
SST Update

In the past week we have seen a major change along the tropical coasts.
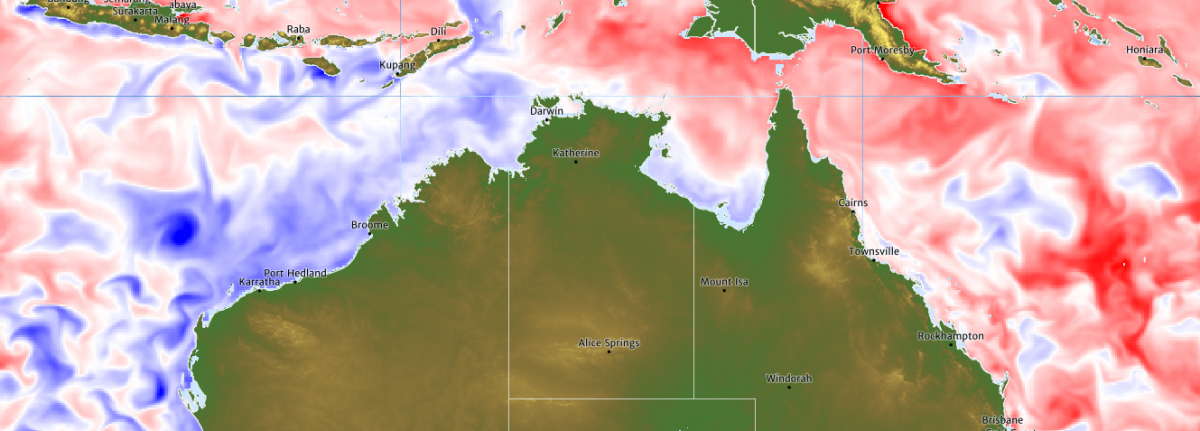
winter inshore waters
Cool water and negative SST anomalies have appeared along the coast of northern WA and NT. The winter production of cool inshore water has started.


We saw this last year at about the same time – from mid-May to September.

At this time of year the SE’ly trade winds start to dominate, causing downwelling along the west-east orientated coastlines. The inshore water in the shallow regions cools overnight by radiation, and then sinks through downwelling and negative buoyancy. A sharp temperature front forms between cold inshore waters and the deeper warmer water offshore (See Condie 2011 and Wijffels et al 2018).
wa cool inshore too
This week, upwelling along the western WA coast is further cooling a region already suffering from colder than normal temperatures.

The OceanMAPS forecast confirms a narrow region inshore of 19 to 20 deg C water, while the Leeuwin Current at 23 deg C sits offshore.

Seasonal anomalies
The OceanMAPS webviewer has a new product: anomalies by season.
The existing percentile view allowed one to see where a parameter sat compared to the annual range.
Now a seasonally-dependent anomaly gives us more information for diagnosing extremes. It is based on a 365-day climatology using the BRAN 2016 dataset. Temperature, salinity and sea level are available. The data can be viewed with depth using ocean profiles too. Transects will be included soon.
To see it, click the left inner hamburger, then look at the drop down list under ‘Select operation’.

For example, here’s a look at the temperature seasonal anomaly with the scale adjusted to +/- 3 deg C. The profile is for a point off Sydney on the edge of a large warm eddy.
![]()

We can see that the water is close to normal on the surface, but over 4 deg C above normal for this day of the year between 100 and 250 m depth.
Compare this to the normalised seasonal anomaly, with the scale adjusted to +/- 3 (dimensionless).


This view gives us more information. The temperature is 1.5 standard deviations above normal all the way down to 300 m depth.
Other features around the country also stand out in the normalised view: the cold eddy from TC Veronica in the northwest, and the heat in the eastern Tasman Sea.
Please have a look at the new product and write to us at BOM with feedback.
