
SST

There has been a general cooling trend in the SSTs in line with this time of year. However, if we look at the anomalies there is not much change to last week. It is still warm on both sides of Tasmania due to Leeuwin Current on one side, and warm eddies on the other. In NSW, a cold eddy has reached the coast and is causing cooler waters than usual near Port Stephens.
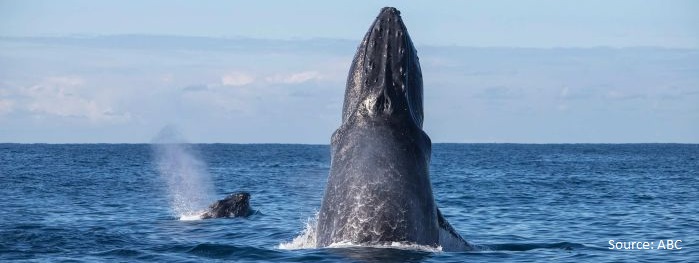
The whale northward migration season is in full swing as Southern Ocean water temperatures cool and whales seek warmer waters for calving. Whales are being spotted in large numbers on WA and NSW coasts. The recent whale census that took place on the 24th of June is likely to show a healthy increase in the whale population.
Last weekend, up to 100 whales were spotted off Cheynes Beach near Albany, WA. Some of these whales were the familiar Southern Right Whales that are normally found in these parts, but some were also humpback whales that are on their way to Broome.
Humpbacks migrate up both the west and east coasts from the end of June, along the typical migration route shown below. Humpback are commonly seen on the west coast from Geographe Bay to Jurien Bay at this time of year.

However, why are these humpbacks off Albany hitting the south coast first rather than going straight up the west coast? The area they were spotted is close to a warm SST anomaly of 2 to 3 degrees C. Are the whales seeking the warm anomaly? Is it beneficial for them to get into warmer waters of the Leeuwin Current early?


Various studies propose that whales may use sharp temperature fronts for navigation purposes. Temperature fronts can also be locations of phytoplankton and other marine organisms, an possible food source. Humpbacks are generally thought to fast during the winter when they are in warmer waters. However, another study proposes that opportunistic feeding may continue in the winter along such sea temperature fronts.
Sea level anomaly
A cold front over Perth in the last few days has kick-started a coastally-trapped wave (CTW) that will bring elevated sea levels to SA and VIC by the weekend. Tides are at springs due to the full moon on the 27th/28th of June. When this CTW and the high spring tides coincide, the sea level viewer shows predicted levels up to 0.5 m above HAT at Cape Jervis.


But wait, there’s more. A stronger cold front is expected to approach the WA coast on Monday with gale-force NNW winds ahead of it. This will generate downwelling and surge along the southwestern WA coast and then kick off another CTW. The positive anomaly will propagate around the southern coastline from Tuesday the 3rd. The sea level anomaly could reach up to 0.6 m in places which is larger than the first CTW. However, as the tidal range will be decreasing towards neaps, the actual aggregated sea level is not expected to reach more than 0.2 m above HAT.


Sonic layer depth
Large discontinuities in sonic layer depth exist off the NSW coast at the moment, as warm and cool waters interact. The image below shows sonic layer depths varying from 325 m in the middle of a warm eddy to less than 10 m just south of a temperature front near Port Macquarie.

The sound speed profiles at three different points along NSW are shown below. The warm eddy in the southernmost point (beige) shows a deep mixed layer, while the warm EAC water to the north (blue) is certainly warmer but the mixed layer is less deep. The central point (orange) is cooler than the other two with a shallow mixed layer.

A cross-section of temperature also highlights the differences.
Comparing SST with sea level anomaly below, we can see that the warm water north of Port Macquarie is butting right up against a strong cold core eddy to the immediate south. Measurements during a recent EAC observation trip (ref: CSIRO/Defence/BOM meeting last week) found that in these cases warm water can ‘spill over’ the top of cold core eddy. The depth of the spilled warm water can be around 20 m and remain strongly stratified.

Such sharp discontinuities in temperature are likely to play havoc with the sonic layer depth and users are advised to look at the OceanMAPS ensemble to gain a feeling for the uncertainty in the forecasts.

