
Sea surface temperature
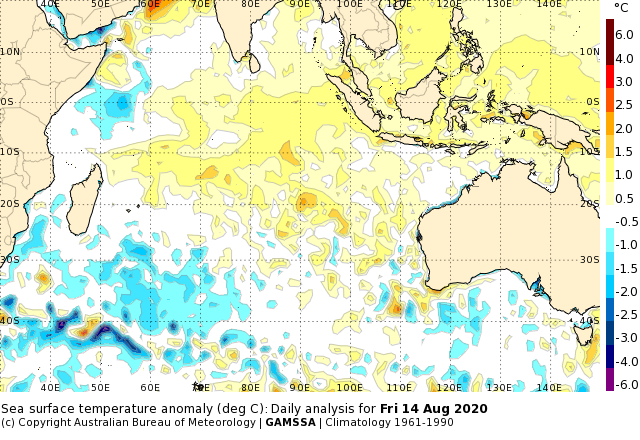
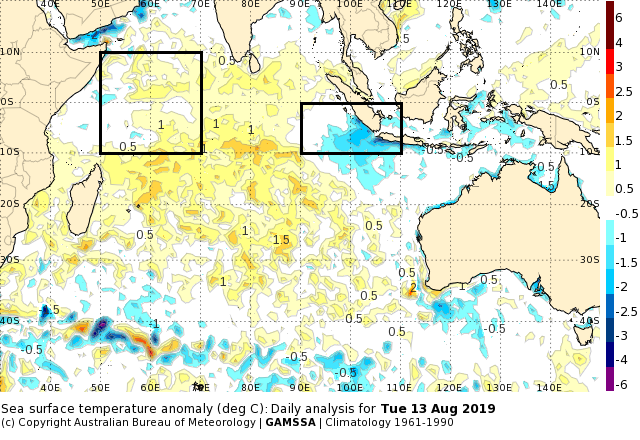
The waters south of Java have been consistently warmer than average this season. Contrast that with one year ago, when there was a persistent cold anomaly in that region.
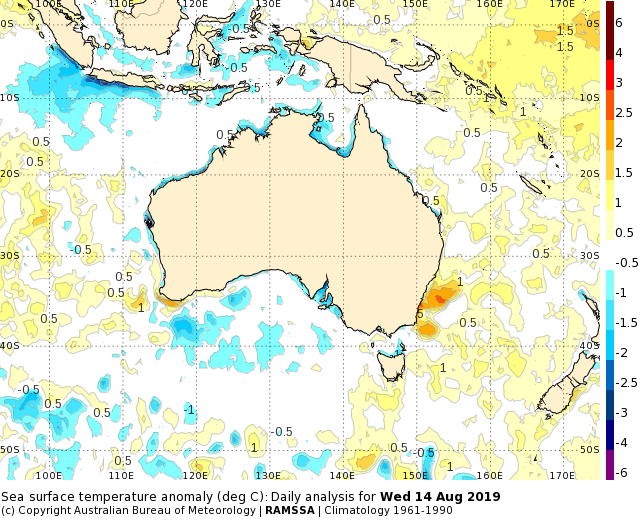
In August last year there was a jump in the Indian Ocean Dipole (IOD) index, and a few months later a strongly positive IOD.
While the IOD is currently neutral, the ocean is certainly hinting at a negative IOD this year, with warmer than average water in the tropical eastern Indian Ocean and some cool anomalies in the west.
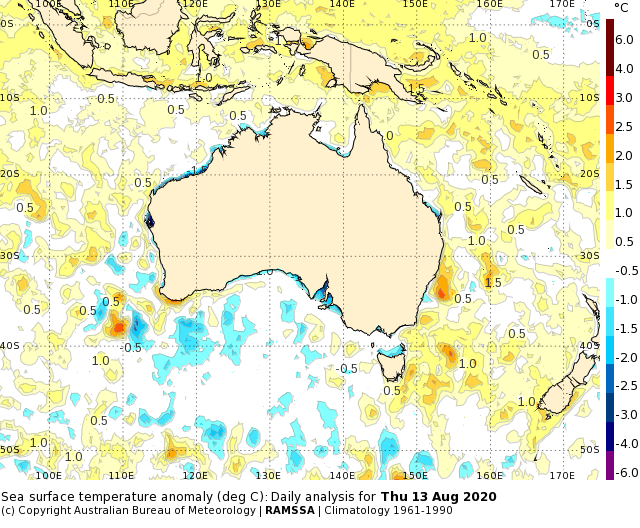
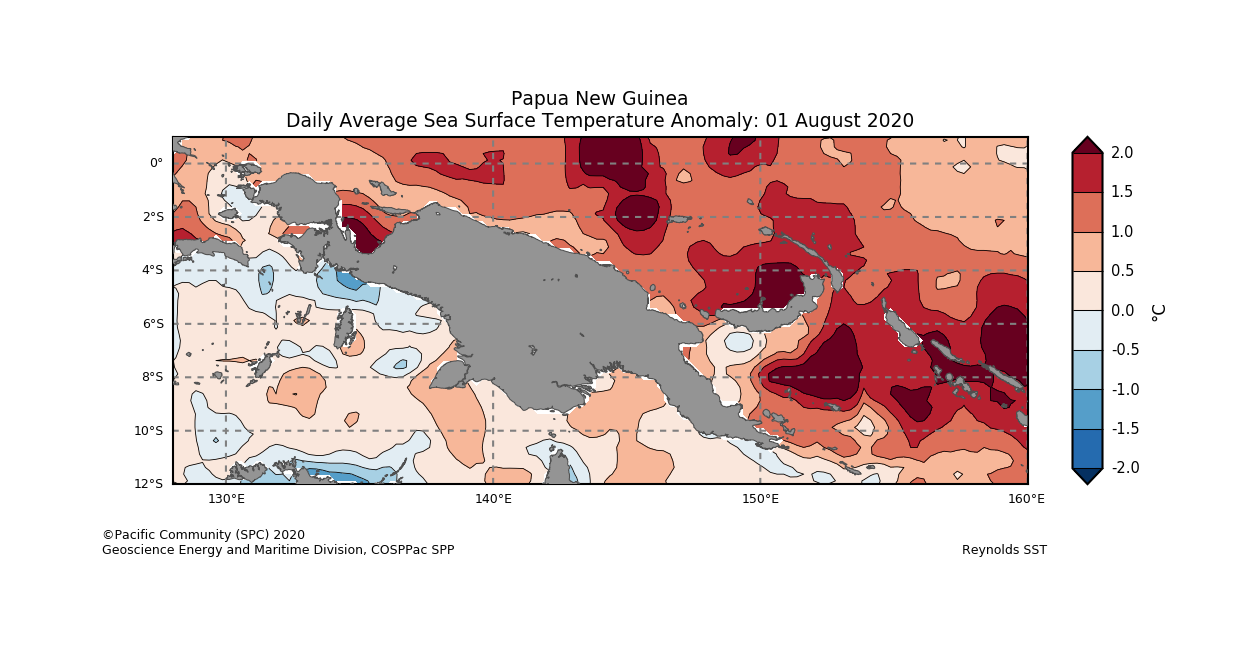
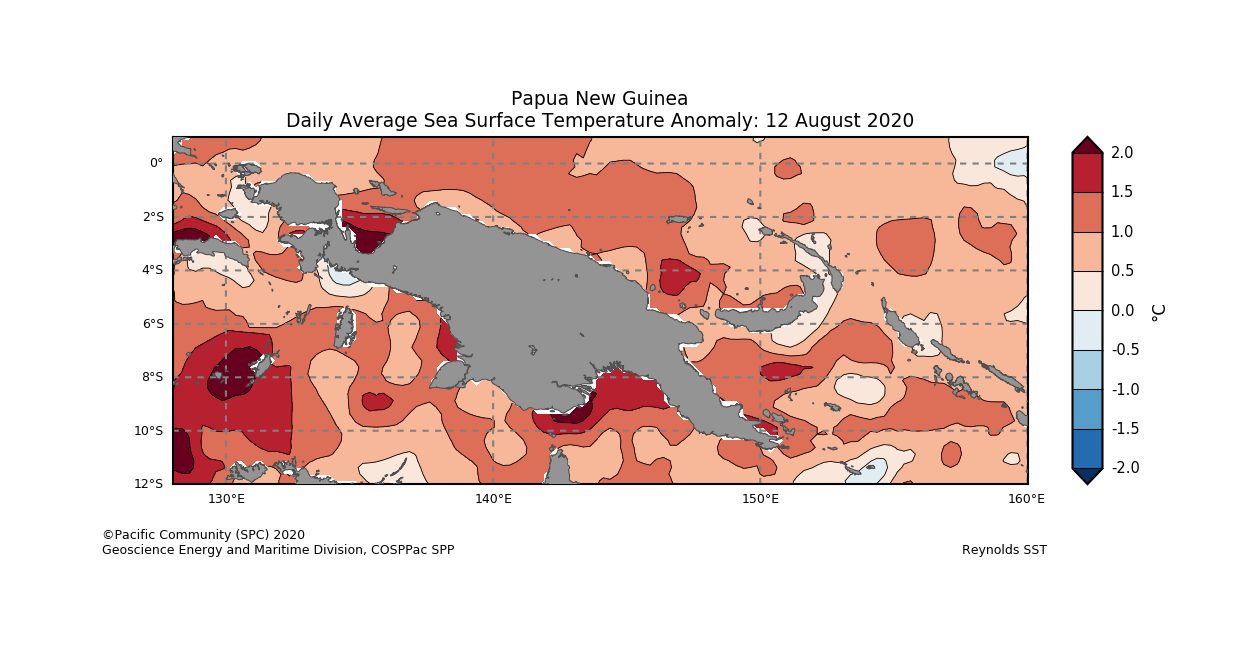
Closer to home, the warm anomalies in Australia’s northeastern waters began to increase earlier this month. The ocean has recently been very warm around Papua New Guinea; parts of the Solomon Sea were more 2 degrees above average on August 1st (shown in the first chart below). The following week, warmth increased in the southern PNG waters, particularly around the Gulf of Papua, with some of that warmth being drawn southeast towards Queensland with the South Equatorial Current.
OceanMAPS is forecasting further warming of the Coral Sea and the Torres Strait, with recent cool anomalies disappearing from the Gulf of Carpentaria. The waters off Cairns will warm by around 1 degree.
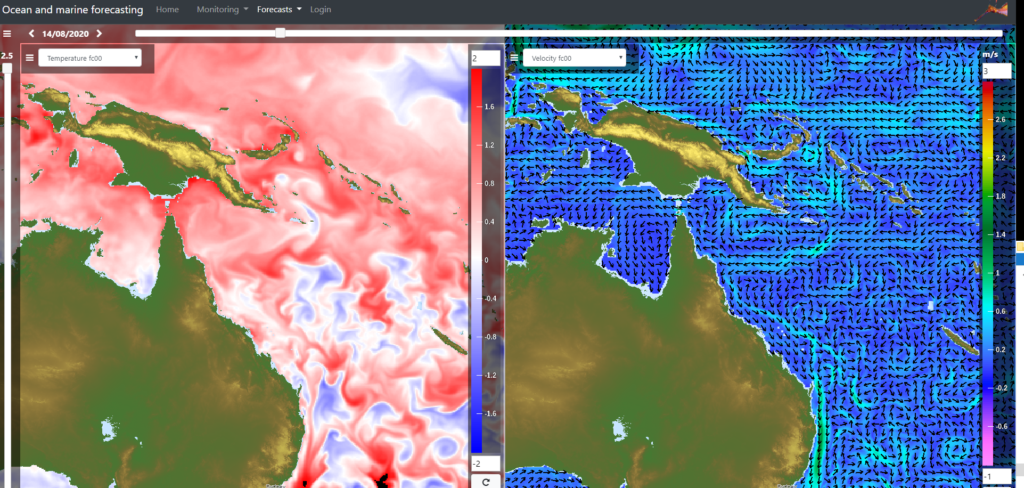
However, the most recent OceanMAPS run indicates the trend may not last, with closer to average sea surface temperatures forecast for 19th August.
Eddies lined up in a row
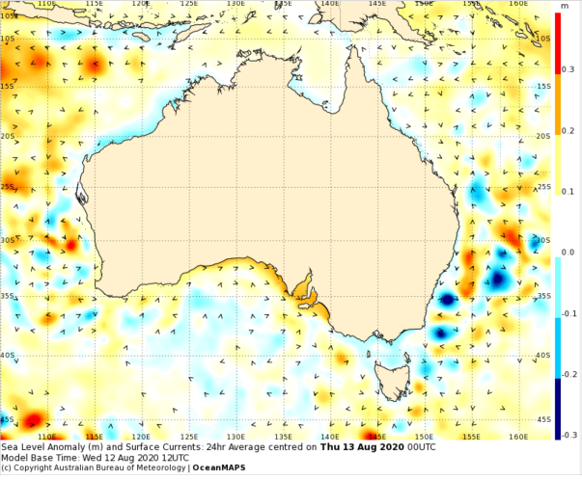
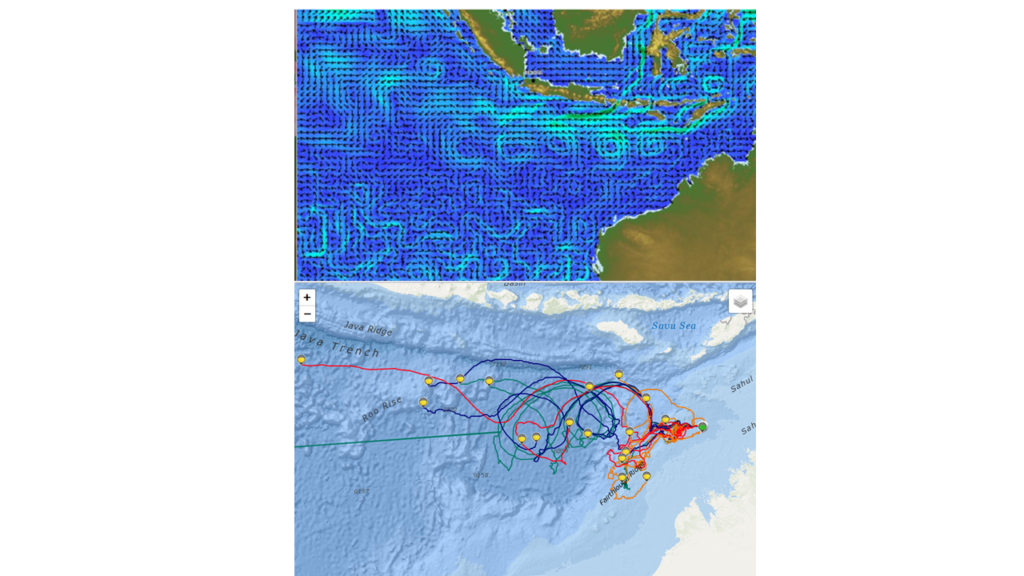
In the northwest, a line of warm eddies south of Java are moving slowly west. The resulting positive sea level anomaly stands out in the chart below. Also of note is the mix of anticyclonic and cyclonic eddies off the coast of NSW at the moment.
The University of Western Australia currently has some drifters in the region and, in a validation of OceanMAPS forecasting, the chart below shows their path as they were caught in the eddies’ currents.
Art that’s made to be broken
Central Coast artist, Pete Rush has been creating driftwood artworks during the coronavirus pandemic. He works at night, to maintain physical distancing and avoid too many onlookers, and uses only dfirtwood, flax and seaweed.

More beautiful sea sculptures here.

Thanks Lucinda for sharing the gorgeous driftwood sculptures.
Re the high SST anomalies for 1 August indicated by the COSPPac SPC portal (oceanportal.spc.int), I was a little surprised by their intensity, since we did not observe such intense anomalies in RAMSSA or GAMSSA anomaly maps on this date at http://www.bom.gov.au/marine/sst.shtml, and nor in the NOAA Coral Reef Watch 5 km SST anomalies at https://coralreefwatch.noaa.gov/data/5km/v3.1/current/animation/gif/ssta_animation_30day_pacific_930x580.gif.
The COSPPac ocean portal uses the Reynolds NOAA OISST v2.1 analyses and the Reynolds 1971-2000 climatology to calculate the daily SST anomaly maps. GAMSSA and RAMSSA use the Reynolds and Smith (1994) 1961 – 1990 climatology, so the baseline is slightly different, but should not produce differences of ~1 K in the SST anomalies.
One should note that on 1 Aug 2020 the NOAA OISST v2.1 SST off the northern coast of PNG were somewhat biased warm compared with both GAMSSA and the GHRSST Multi-Product Ensemble according to the NOAA SQUAM web site, see
https://www.star.nesdis.noaa.gov/sod/sst/squam_dev/squam_data/v2.0/analysis/data_l4/outlier_retained/2020-08-01/map_2020-08-01_Reynolds-GAMSSA_MEAN.png
and
https://www.star.nesdis.noaa.gov/socd/sst/squam/analysis/l4/?l4sst=Reynolds&ref=GMPE&aggtime1=daily&var-stats2=MEAN&c_year=2020&c_month=08&c_day=01#maps