
- A giant pumice raft in the Pacific
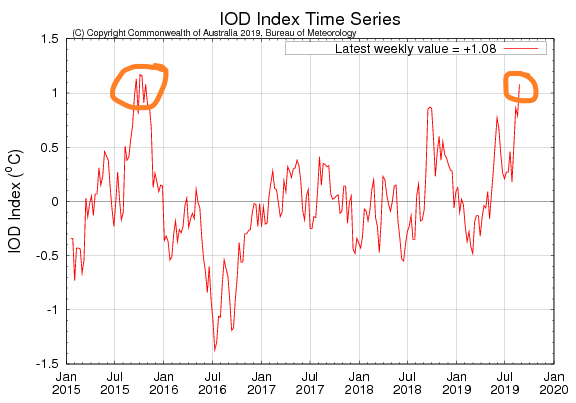
- The IOD spikes even higher
- LAT to HAT: a steep sea level gradient
SST update
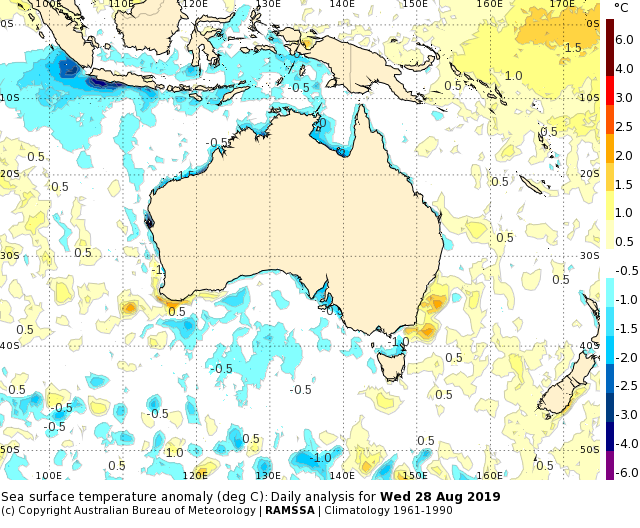
Surface waters of the Great Australian Bight are largely cool, including the St Vincent and Spencer Gulfs.
Meanwhile, the cool anomaly to the country’s north has spread and slightly intensified.
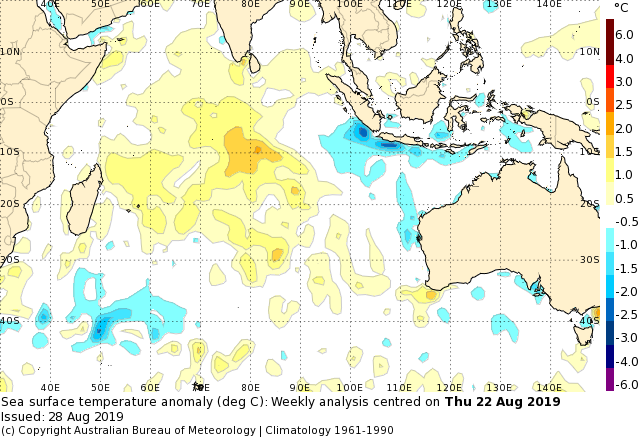
There is a very cold patch in southern Sumatra due to upwelling. This is now inside the eastern IOD box and has caused the IOD index to spike further to a value of 1.08.
Last spring the IOD didn’t get over 1.0 but it still had a dramatic effect on reducing rainfall in eastern Australia. We haven’t seen an index this high since October 2015.
The latest climate outlook depicts lower than average rainfall expected for most of the country this spring.
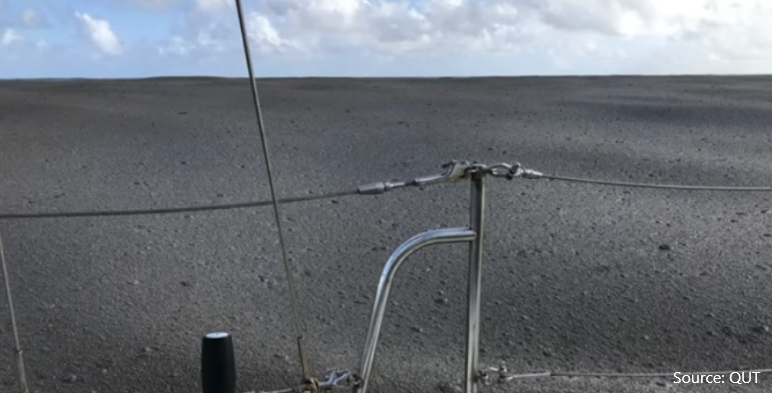
Raft of rocks inbound
A raft of pumice stones has been spotted in the Western Pacific.
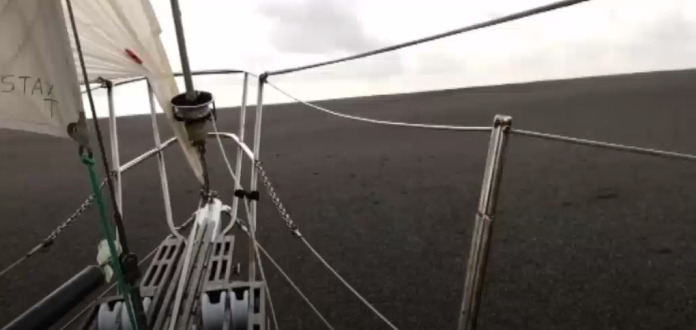
Cruising sailors uploaded an eery video of the continuous pumice field and how it modulated the ocean waves around them.
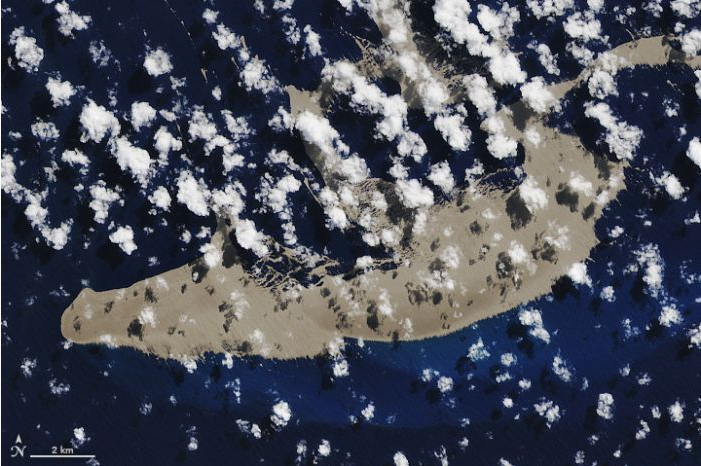
Satellite images confirm that the pumice field is about 35 km long and 2.5 km wide. NASA observers compared it to the size of Manhattan Island.
The origin of the rock is thought to be a submarine volcanic eruption near Late Island over three weeks ago. Lava from the eruption rapidly cooled underwater to form porous rock.
The sailors Michael Holt and Larissa Brill said that the pumice smelt of sulphur. The thick weight of it smoothed the waves and scraped the hull of their boat clean.
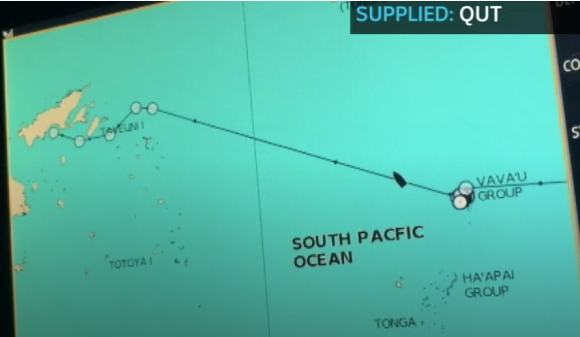
Where it is heading? What will the impact be?
Scott Bryan, a geologist from QUT, says that pumice rafts can drift for years and attract marine life. It may prove a boost to the Great Barrier Reef, where he expects it will wash up in 7 to 12 months time.
Will the raft reach the Great Barrier Reef before it disperses or deteriorates?
It is 2000 nm away.
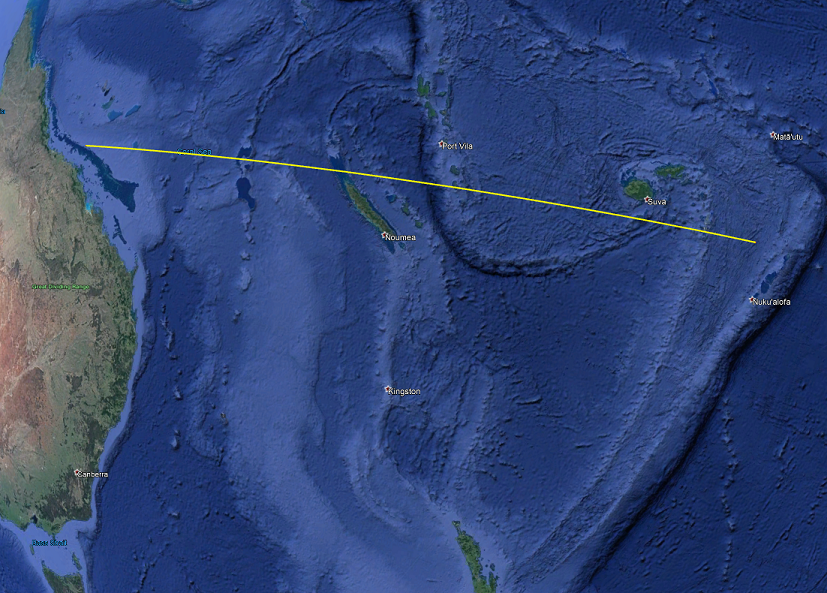
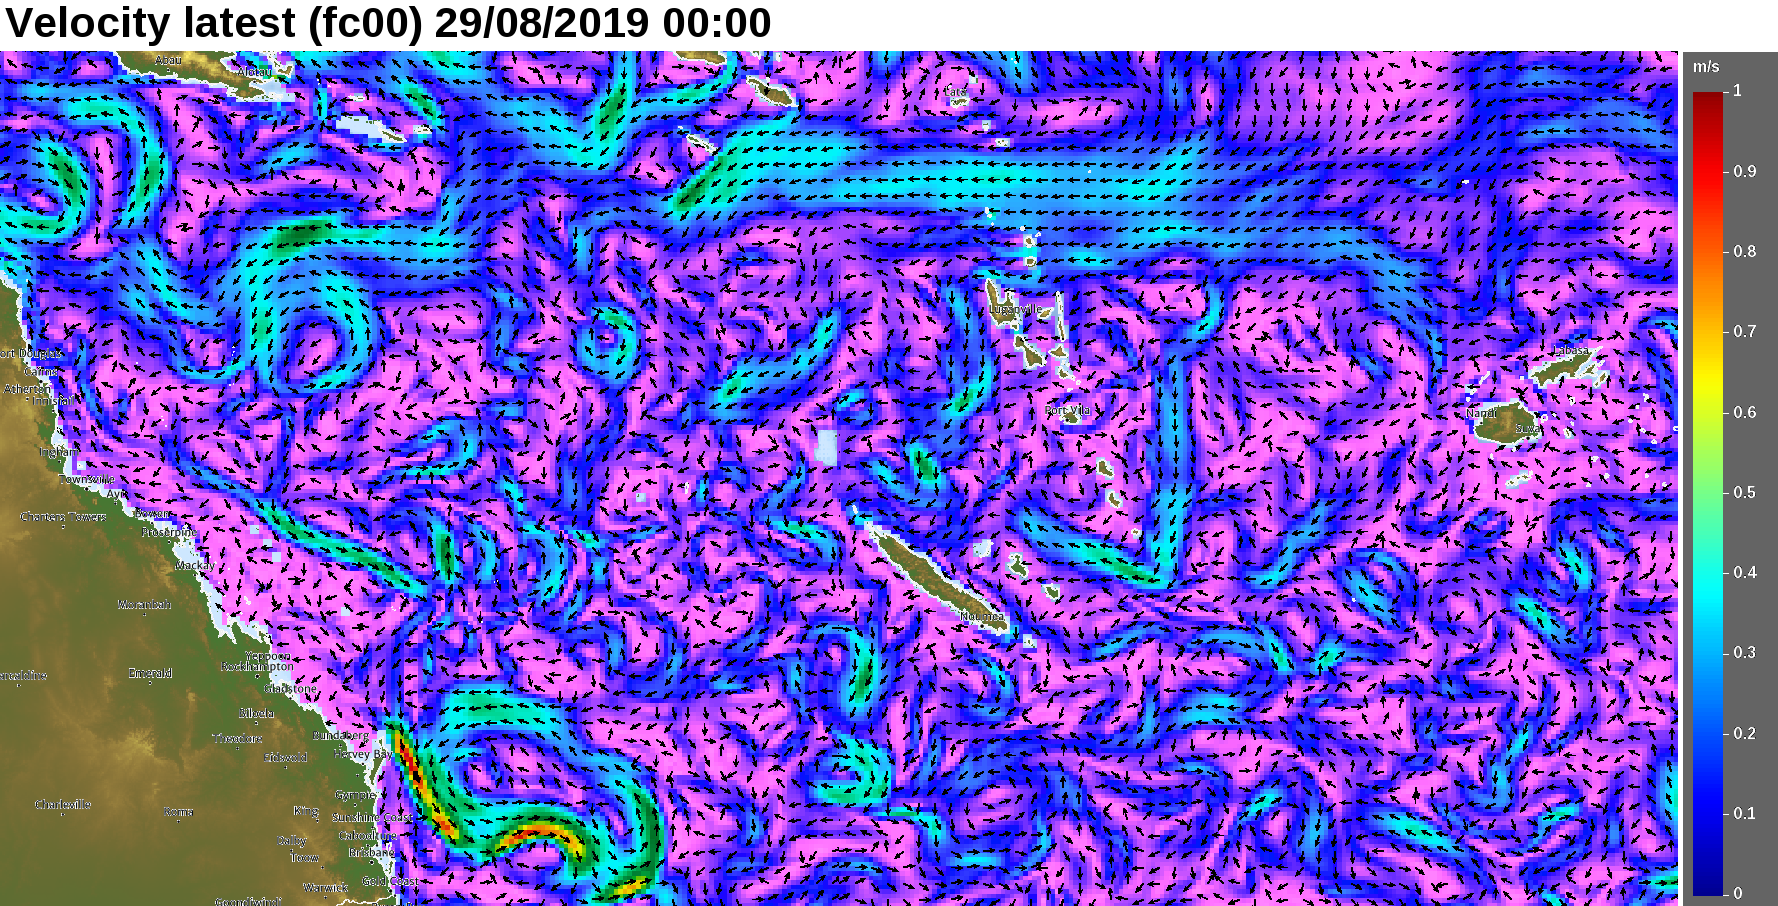
A quick look at OceanMAPS shows that if the raft is affected by ocean currents only then it will be a very meandering path to Australia.
But unlike icebergs, the pumice raft is only 30 cm deep. Wind and waves will push the raft as much as surface currents.
Pumice rafting is actually a well-studied phenomenon … and it turns out that this has happened before. The Tonga/Fiji region has produced at least eight large pumice rafts in the last 200 years.
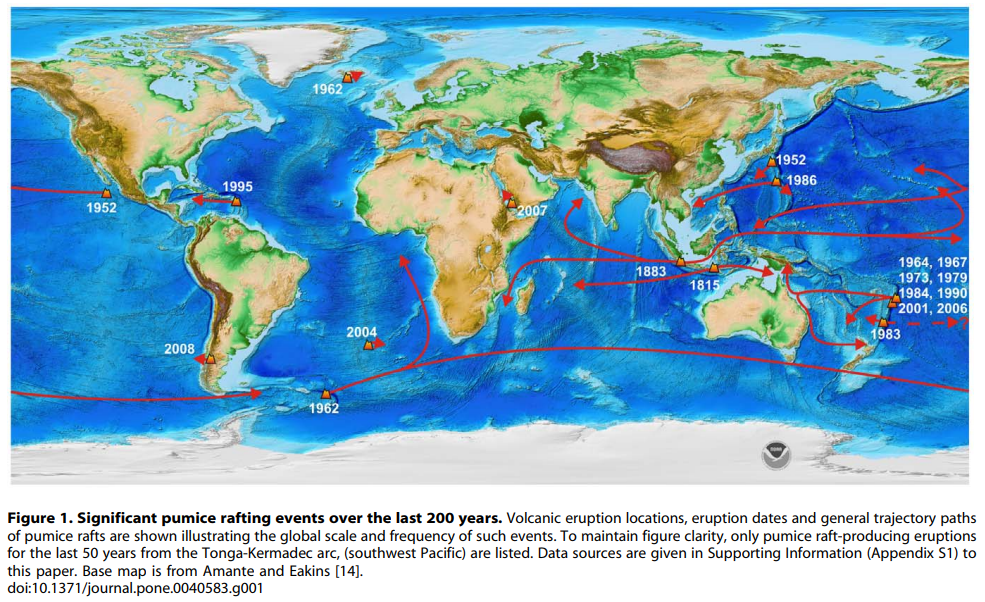
A 2006 pumice raft from the region travelled westward at 0.23 m/s to arrive in Australia after 7 months. This was twice as fast as the estimated current speed of 0.11 m/s. Bryan et al (2012) credited strong and persistent trade winds, and no disruptions by tropical cyclones. A lot of material was deposited on islands along the way, but about one third of the original material reached Australian waters. A similar event happened in 2001 as well.
Papers that modelled these raft trajectories used empirically calculated surface currents from a combination of wind-driven Ekman transport, geostrophic velocity and sea surface temperature corrections. Not a full ocean model. However, even with accurate ocean currents, modelling of pumice rafts is fraught with difficulties due to the various particle sizes and freeboard above the surface, and then the change in weight over time due to organic matter accumulation.
In any case, it’s heading our way. Next autumn let’s keep an eye out for a rocky raft of pumice with its biological cargo.
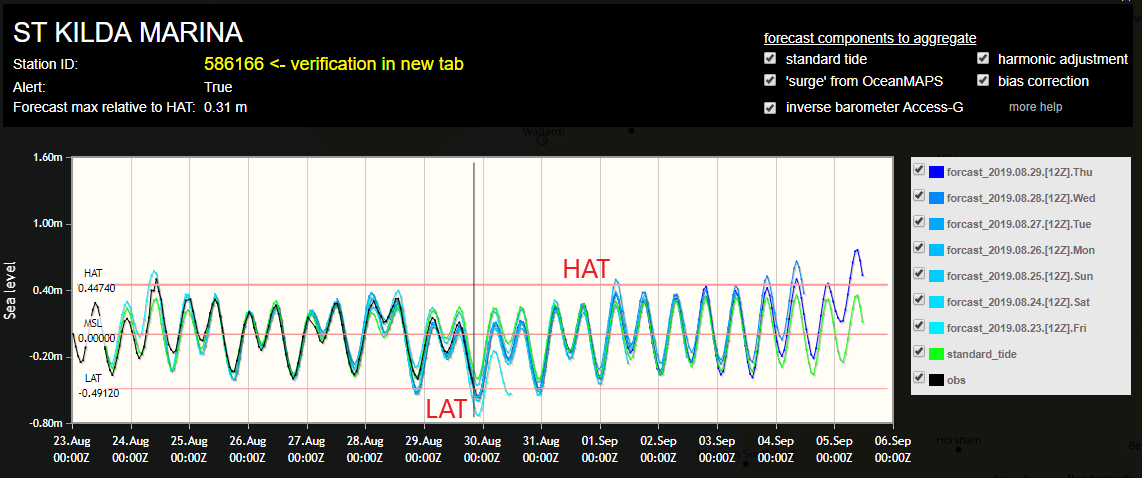
LAT to HAT
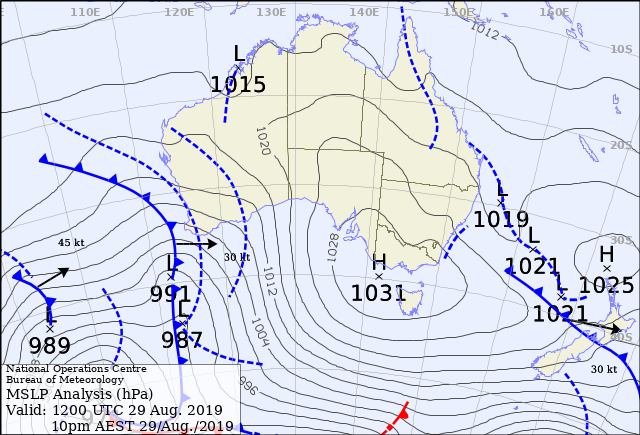
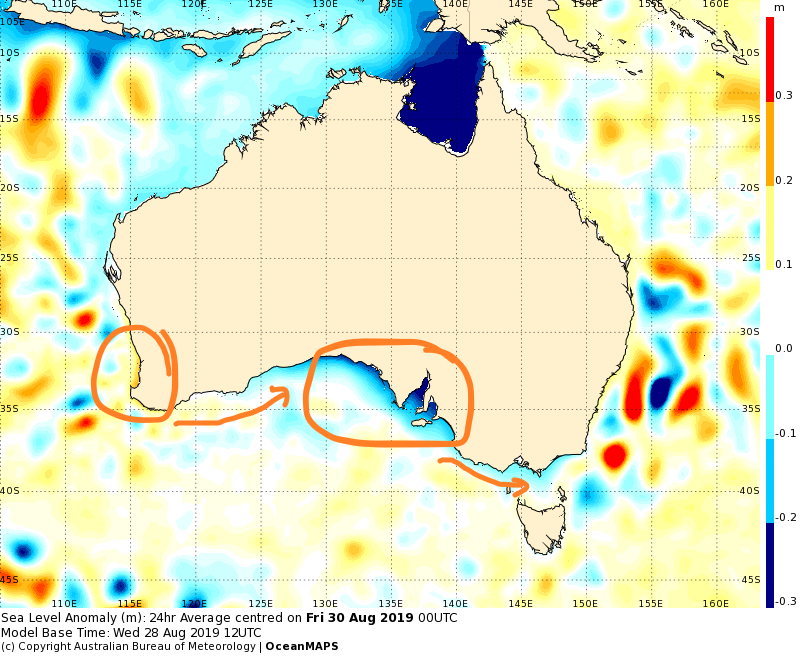
A combination of events is causing sea levels to vary sharply along Australia’s south coast.
Firstly, strong NE’ly winds along South Australian coasts will drive Ekman transport away from the shore on Thursday and Friday. Secondly, the atmospheric pressure is hovering around 1031 hPa for two consecutive days and will push sea level down through the inverse barometer effect. These are combining to cause a negative sea level anomaly.
The aggregate sea level viewer suggests levels will reach below lowest astronomical tide (LAT) on Thursday and Friday in some parts of South Australia and Southern Victoria.
In the meantime the N to NW winds along the WA coast will kick start a coastally trapped wave. This will cause positive sea level spikes that will travel anti-clockwise around the country close on the heels of the negative anomaly.
But wait, there’s more. Spring tides will occur along the eastern seaboard this weekend.
If you add all these small coincidences up then the local effect can be dramatic. Within 48 hours, some locations will switch from LAT to HAT.
A question to ponder for today – is this rate of change an extreme event, independent of the magnitude reached?
