
SST update
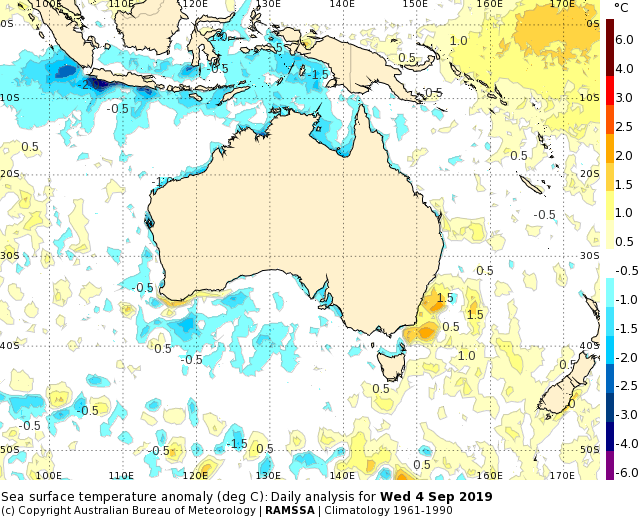
There has been an enhancement of cooling in northern regions. Particular cool spots are in the Gulf of Carpentaria, south of west Papua, and south of Java and Sumatra.
Meanwhile the warm spots in southwest WA and NSW continue.
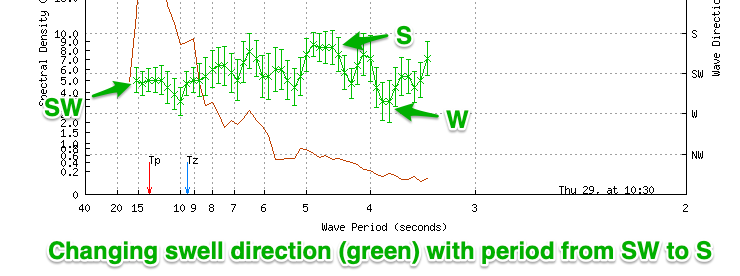
Speccy spectra
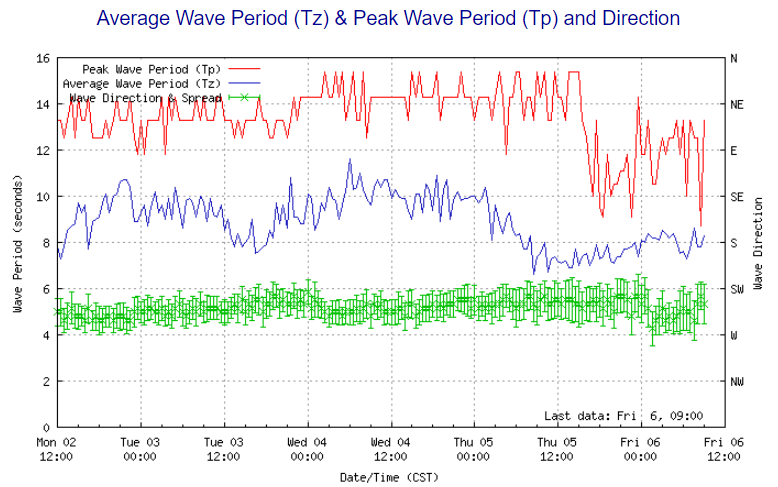
New triaxys wave buoys have been installed by the BOM at Cape Sorrell in western Tasmania and Cape du Couedic off Kangaroo Island in South Australia.
The new buoys provide directional information, and this data stream has been added to the observation pages on the Bureau’s public website.
The pages can be found here:
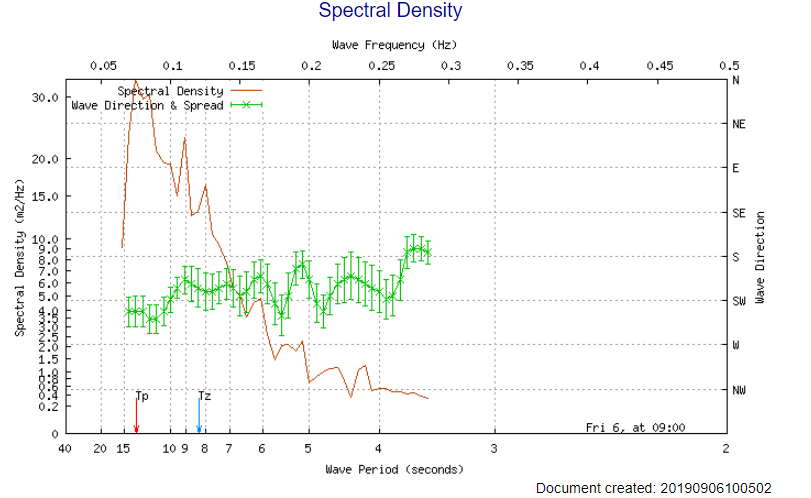
Example plots below from today:
The rollout has not gone unnoticed.
The popular surfing blog SwellNet has been quick to promote and explain the charts. Read the full article here.
Nevertheless, the number of comments underneath the article suggests this new information will be popular.
The biggest grumble from online commentators is that the information makes it too easy for people to assess the conditions, and “the relentless march towards 100% accuracy” in wave forecasts means good surf breaks will be packed with the “worst type of crowd”.
This protectionist approach claims that only those with local knowledge should enjoy the best waves.
For the rest of us, I’m sure the extra data will provide fresh insights.
Drifter caught in the Throughflow
The First Mariners have deployed a drifter off the coast of Timor that has been spun around in eddies before being swept away by the Indonesian Throughflow.
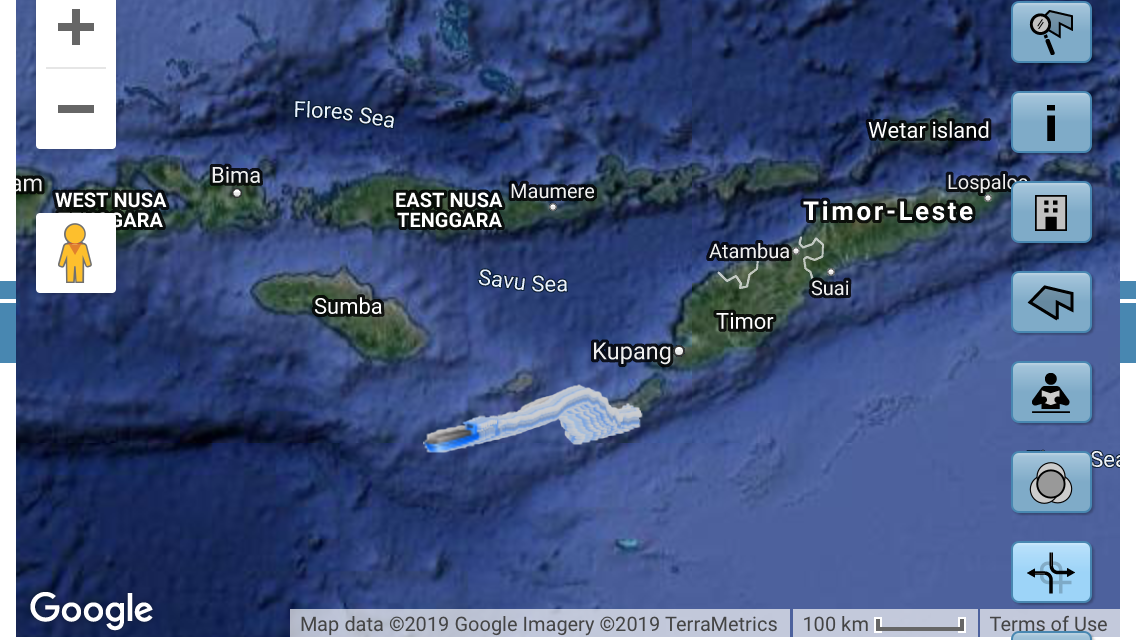
The group are preparing for a re-enactment in February 2020 of a possible ancient migration route from Timor to Darwin: on a 20 metre-long bamboo raft.
To test the means of propulsion across this distance they have deployed surface gliders to understand the ocean currents in the Timor Sea.

Their first glider test in February 2019 went southeastward first before looping around to the coast, but this recent one behaved very differently.
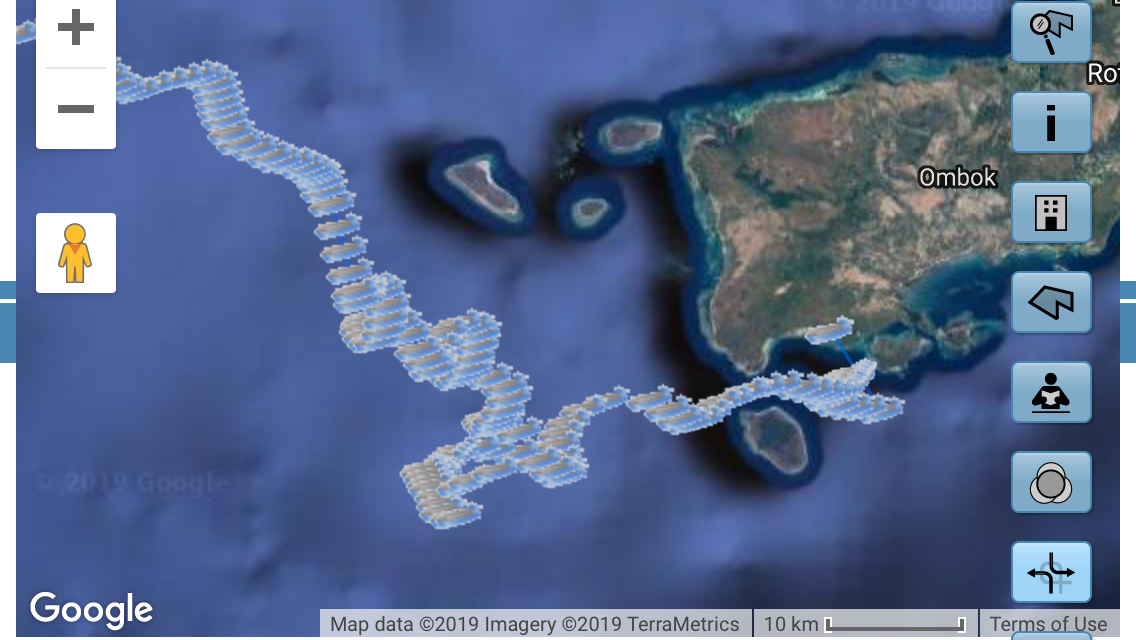
A zoom-in shows that the glider was caught in eddies that form downstream of Timor and Rote Island when the Indonesian Throughflow is flowing hard on the north and south sides. The Throughflow is at its strongest in the austral winter.
Do our ocean models capture these dynamics?
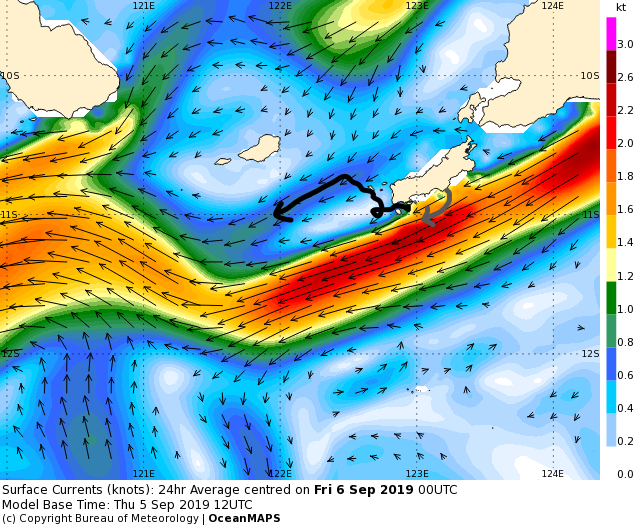
Let’s look at the OceanMAPS analysis from that time, and the 2km ADEPT model at a similar time last year (this year’s is not available).
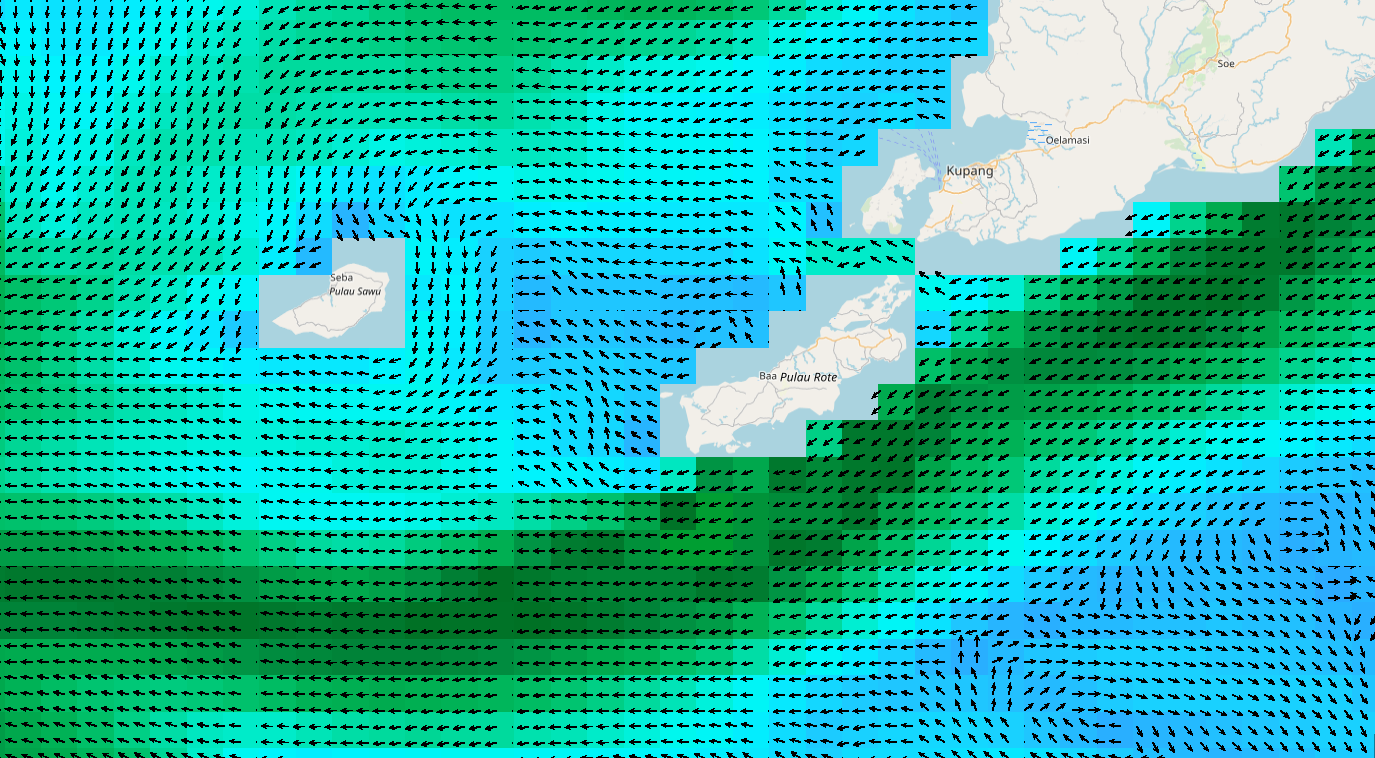
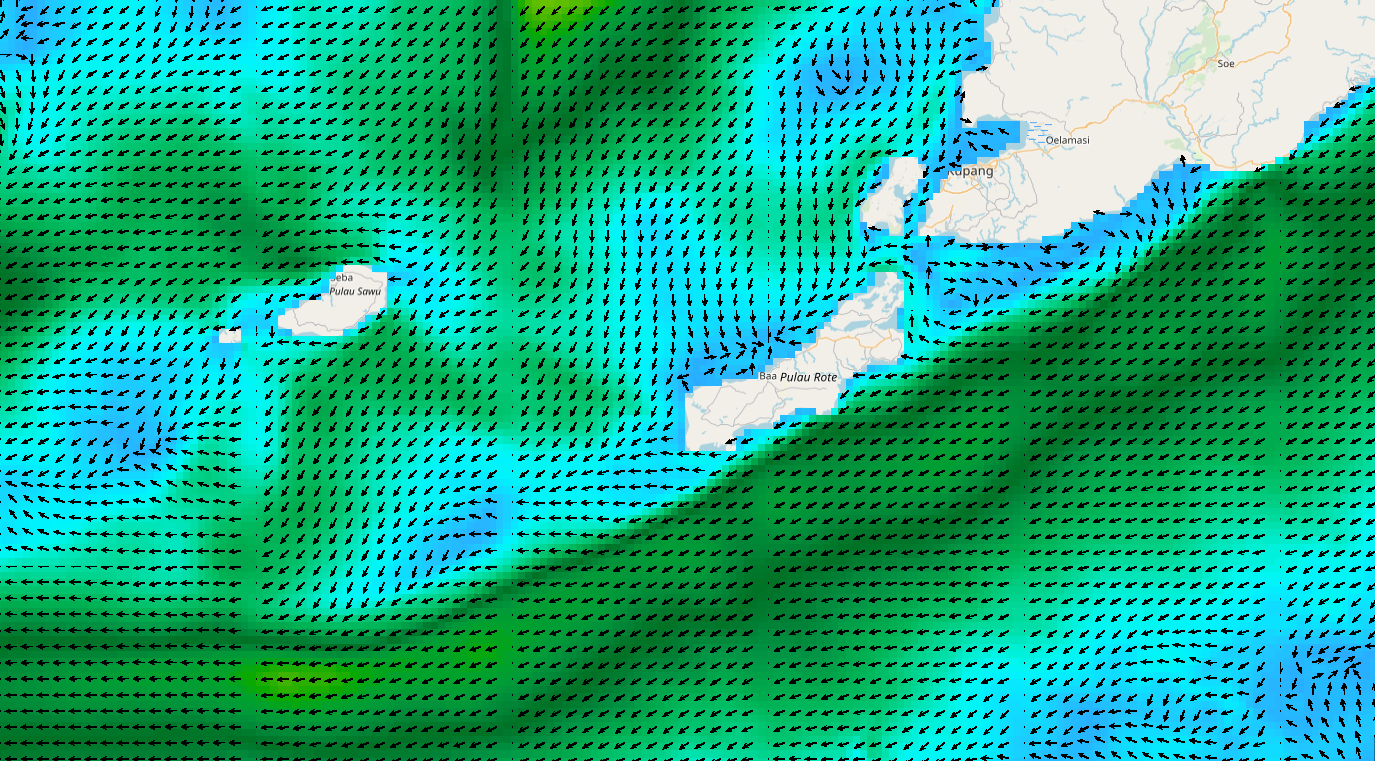
Both models are capturing the strong flow along the southern side of the main islands; also the slight northwestward current curling around the bottom end of Rote Island. However, model resolution prevents either of them capturing the turbulent eddies. The southwestward straight-line flow the drifter encountered halfway to Sawu Island also seems fairly weak compared to the observed track.
The glider stopped transmitting on the 30th of August – probably due to water ingress.
The First Mariners team are planning to launch another drifter in mid-October – sealed with PVC glue or concrete. The planned location is the southern middle side of Rote Island in the hope that the glider gets caught in the main current.
As a science experiment this is pretty cool. Whether it helps the full-scale bamboo raft in February travel eastward towards Darwin is another question ….

Thanks for reading and summarising the online comments on the swellnet page so that we don’t have to!
I noticed the following comment on the swellnet blog though:
If the red Tp arrow sits to the left of the peak in energy, ie around 19s, with the peak in energy sitting at 14s, this will show that the long-period forerunners have no size to them, and the bulk of swell is still mid-period energy.
The Tp arrow is always going to be precisely at the peak in energy, so I don’t think he’s got that quite correct…did anyone comment on that in the comments?
Hi Diana, good spotting and thanks. That is an incorrect point from SwellNet. I didn’t see anyone correcting them on this in the comments. However, Lucie from Marine Services is going to write to Swellnet about it.