
SST update


Tasman Sea anomalies have weakened through most of the region apart from a small hot spot at 3 deg C above normal in far eastern Victoria, near Gabo Island. This is due to a warm eddy that has been tracking southward.
In the northern part of the country we see negative anomalies along the coast due to the winter production of cold inshore water. The signature is particularly strong in the south-eastern corner of the Gulf of Carpentaria and along the Pilbara coast.
Upwelling off Java

The most striking new feature is along the south coast of Java in Indonesia where we can see cool anomalies from upwelling. Persistent southeasterly trade winds have caused Ekman transport away from the shore on the south coast, allowing deeper and cooler water to upwell.
There is a sharp contrast from one side of the island to the other. The south coast has temps of 24 deg C, while the north coast is experiencing 30 deg C.

A weak negative sea level anomaly has developed due to the upwelling on the south of the island. However, geostrophic currents around this feature are complicated by the Indonesian Throughflow. The surface currents through the Lombok Strait are very strong, particularly at this time of year. OceanMAPS values show up to 4.0 knots. Locally the currents are likely to be stronger at times due to tides and more detailed bathymetry.

Erosion hot spots
Erosion is back in the news in the west and east as the first of the strong winter storms take their toll. But is this just natural variability?
western australia

In Fremantle WA, the sand at Port Beach washed away during a storm two weeks ago. The footpath to the public changerooms has collapsed and the owner of the Coast restaurant (seen in the centre of the above image) says this is the stuff of “nightmares”. A similar erosion event occurred at the same beach last year. A study by the WA Department of Planning found that the beach was eroding by 0.8 m per year, putting local facilities at risk. This is a shock for locals (including this author). However, the acceleration of erosion since the 1970s in this particular spot makes more sense in context: dredging material from Fremantle Harbour stopped being dumped in vicinity forty years ago. Port Beach relied on the transportation of this sand. Without this source of replenishment the local council is considering installing a sea wall, and also moving the main coastal road further inland.
They won’t be able to do that in time for the next big storm which is due to arrive tomorrow and Sunday. The forecast is for 2.5 m seas and 3 m swells from the west on Monday morning, which will combine to an expected Hs of 4.5 m coming straight onshore. Sea levels will also be elevated due to downwelling from the north-westerly winds ahead of the system.
Another frontal system to hit Perth on Wednesday will bring significant wave heights of 5 m from the southwest. Port Beach is usually sheltered from these waves by the presence of Rottnest Island; however the erosion trend shows that it is still vulnerable.

victoria
In Victoria, rapid erosion is being observed at Inverloch. New mitigation works have been implemented for this winter (after the last works were destroyed in a storm) but they are already being washed away during moderate events.
On Wednesday the 19th of June, a BOM forecaster observed the beach before and after high tide.

The fresh piles of sand retreated away from the left hand row of wooden pickets. Perhaps 0.5 to 1 m was washed away.
The high tide on that day included about 0.25 m of sea level surge, which put the sea level just over HAT at nearby Patterson River. This did not seem extreme.

The wave setup was also a contributing factor. However the recorded Hs at Pt Nepean was only 2.7 m at the time and the Hmax was 3.66 m. Inverloch beach is conducive to wave setup, but nobody would call these wave heights unusual for this time of year.

The mild nature of this event has forecasters scratching their heads. It provides a counterexample of the prevailing belief that you need large waves for an erosion event. It also shows that these mitigation works are not sufficient.
tasmania
In Tasmania, coastal erosion is ringing alarm bells and sandbags are being used to prop up infrastructure. Some houses are no longer insurable for flooding. Local councils are being guided by reports that indicate rising sea levels and extreme rainfall will increase the frequency of coastal inundation and erosion.
STUDIES and campaigns
A UNSW study contends that the natural variability of beaches is very large and there is little evidence that rising sea levels are contributing to increased erosion. At Collaroy NSW, for example, there has been no net erosion. Associate Professor Ian Turner says it is the change in wave activity that might be causing erosion at particular places.
The public (and you) can contribute to erosion monitoring through a program called CoastSnap. When you see a phone holder at a NSW beach, simply take a photo from the holder and share with the CoastSnap program.

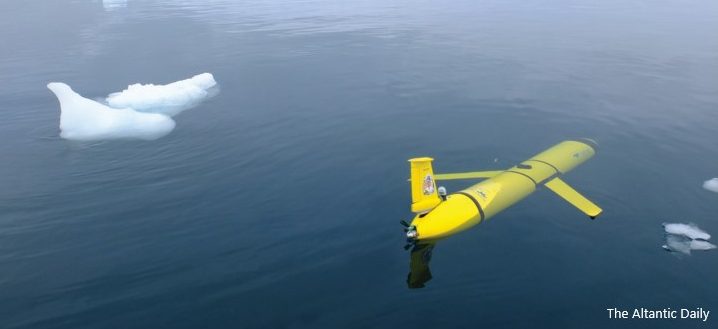
Discoveries by the loveable submersible
Boaty McBoatface has observed unique melting mechanisms along the Antarctic Peninsula. News agencies around the world have commented on these discoveries, presumably for the chance to use the most loveable name of any oceanographic instrument. Stories have appeared on the BBC, Telegraph, CNN, NY Daily, among others.

Boaty is a publicly-named AUV onboard the British ship RRS David Attenborough. In 2017 it conducted measurements of temperature, salinity and turbulence along the Southern Ocean floor in the Orkney Passage.
See animation video here.


The results have been published in a recent paper entitled: “Rapid mixing and exchange of deep-ocean waters in an abyssal boundary current” by Garabato et al (2019). [Note: in its professional manner, the paper refers to Boaty as the ‘Autosub Long Range’, which is a bit less catchy].
The crux of the results is that as abyssal water flows along steep topography, friction causes submesoscale instability and promotes an overturning circulation that has impacts far from the local turbulence. The warmer surface water is mixing down to the abyssal water with an overall warming effect.
Subsequent concerns are that as Southern Ocean wind speeds increase, the trend will be exacerbated. Scientists involved say that this mixing mechanism must be included in future climate models if we are to understand the rate of ice melting.

A description of the above schematic is best explained by a quote from the paper itself:
The direction of the boundary current is indicated by the cross and the direction of the cross-slope overturning is denoted by solid black arrows. Surfaces of constant density are shown as interfaces between blue-shaded layers. The sense of rotation of the boundary current’s onshore edge is indicated in the upper axis. Topographic stress on the boundary current induces a downslope flow, which advects light water under dense and thereby promotes gravitational instability (GRV) and vigorous mixing near the boundary. Centrifugal (CTF) and symmetric (SYM) instabilities occur further from the boundary and drive a lateral exchange of well-mixed near-boundary waters and stratified interior waters (Garabato et al 2019)
A fascinating oceanographic result.
But perhaps the key lesson in all of this is: if you want your ocean science to be well-promoted, give your instrument a cute name.
