
- Persistent cool temps in the west – Ningaloo Niña may be the culprit
- Late TC develops in northern basin
- NSW temps staying warm
SST update

The SST anomaly pattern around the country has remained fairly stable this week. Most of the Tasman Sea anomalies have either eased or moved eastward. Southern New Zealand remains a hot spot. However, the extreme heat in southwestern Tasman Sea that we saw in January has gone. There is even an area of neutral anomalies just east of Tasmania.
temps
Along the NSW coast we have seen a slight ease in anomalous heat but with the large warm eddy hugging the coast it is all relative. A month ago we were seeing SSTAs of 2.5 deg C, but now most places are back to 1 to 1.5 deg C.


The buoy at Sydney is measuring 21-22 deg C. As the warm eddy moved south it caused a warming at Port Kembla up to 22 deg C last weekend. The eddy is now abeam of Jervis Bay.

Meanwhile, there are strong cool anomalies to the south of WA. It seems to be caused by an intrusion of cold water from the south. In the analysis field (bottom left) it appears like a ‘wave’ in the boundary between Southern Ocean and Indian Ocean (Leeuwin Current) waters.

Ningaloo Niña
Those of you who have been tracking the SST pattern for the last six months would know that while it has been hot in the Tasman, it has been cold in the Indian Ocean.
In the spring we called it a positive IOD.
Then the IOD index fell back towards neutral in December. The cool anomalies moved further south away from the defined IOD area, but the anomalies persisted in the broad WA region. They lasted all summer and autumn.
Is this a case of the elusive Ningaloo Niña?
The term is relatively new. It was coined in 2013 by Feng, McPhader, Xie and Hafner when they linked unprecedented warming of the Ningaloo Reef to remote forcing due to the 2011 La Niña in the Pacific. Equatorial wind anomalies changed the strength of the Leeuwin Current which directly affected the water temperature around the reef.
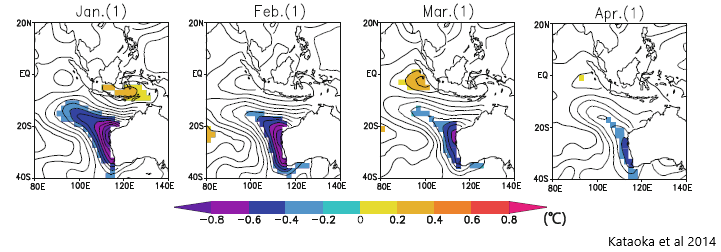
Similarly, if the equatorial wind anomalies are negative (lighter wind) then the Leeuwin Current weakens and the ocean temperature cools. Kataoka et al (2014) used the ERSSTv3b dataset from 1950 to 2011 to create composites of SST anomalies in Ningaloo Niño and Niña years. See below.

From some of my saved daily SST analyses, I attempted to reconstruct the chart above for this season.

If you compare the two sets of images there are some similarities. The cool anomaly starts by spanning much of the east Indian Ocean basin, but then retreats to be more of a coastal phenomenon in the late summer.
So what is causing it?
Kataoka et al (2014) posited that there are two types of Ningaloo events: locally-forced and remotely-forced.

This summer has been firmly in Category (d): a non-locally amplified Niña. The monsoon has been particularly weak, and high pressure has dominated across central and northern Australia (see below). Furthermore there has been a weakly positive Nino 3.4 index since spring which may weaken the Leeuwin Current through the Clarke-Meyers effect (for full explanation see Kataoka et al 2013).

The Ningaloo Niño/Niña tends to occur every 3-5 years on average and is said to develop in spring and peak in summer. (Feng et al 2013, Kataoka et al 2013)
In a recent paper, Kataoka et al (2018) found that the Ningaloo Niño/Niña can develop in coupled models if ENSO is entirely removed. These are the locally-forced scenarios where the mechanism is local air-sea interaction off the west coast.
The Ningaloo Niño/Niña will be a phenomenon to watch in coming years.
TC Lili in the north
A late season tropical cyclone has developed in the northern Timor Sea. It was named TC Lili by the TCWC Jakarta on Thursday.

Although it is very close to Australian waters, it still remains outside our jurisdiction.

What are the ocean factors contributing to this late cyclone?

The sea surface temperatures are about 29 deg C in the area which is more than enough to support cyclogenesis. However, if we look at tropical cyclone heat potential (TCHP) we can see a ‘hole’ to the north east of Timor where the low first formed. The hole suggests that there is not a lot of heat content for the cyclone to draw on in that spot.
The track shows that the tropical low moved to the east-southeast of Timor yesterday and intensified and stalled there. Was it drawn to better heat content?
A new way of viewing OceanMAPS anomalies has been developed. In the webviewer you can select ‘Seasonal anomalies’ and ‘Normalised Seasonal Anomalies’. The anomalies are calculated using a 365-day 3D climatology from the BRAN dataset. Please note that the product is experimental at the moment and this blog will explain more over the coming weeks.
For now, let’s have a sneak peek at the seasonal anomaly of temperature with depth at TC Lili’s location.

The data suggests that it is 1 deg C cooler than normal for this day of the year down to 41 m depth. Then warm/neutral for a while, and then cooler again below 100 m.
Compare this to the spot where the TCHP hole is. We can see that to the northeast of Timor it is okay on the surface, but much cooler than normal between 50 and 400 m depth. Indeed, it is a heat content hole!

Given the weak heat available from the ocean, it is no wonder that TC Lili won’t last long. Atmospheric factors will also play their part and TC Lili is expected to decay later today.
