
- Sudden Stratospheric Warming: will it impact the ocean?
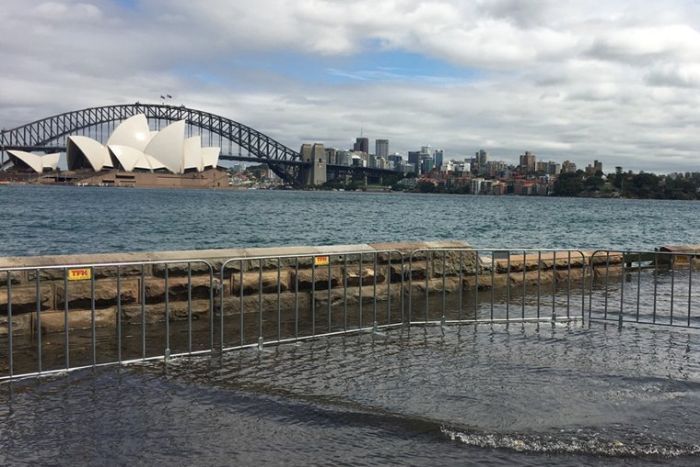
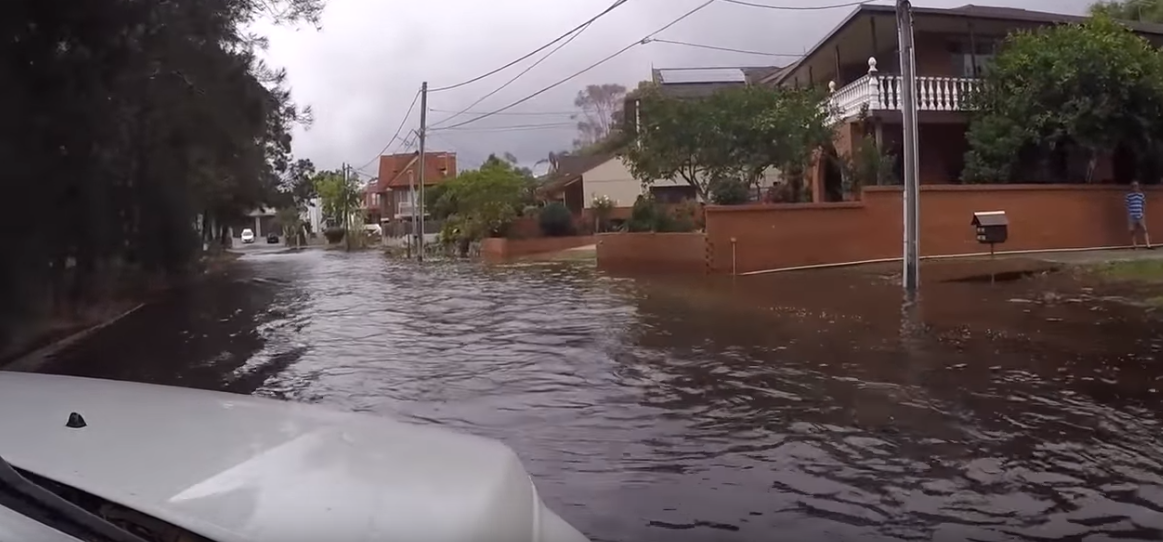
- Coastal flooding projections for Sydney by 2100
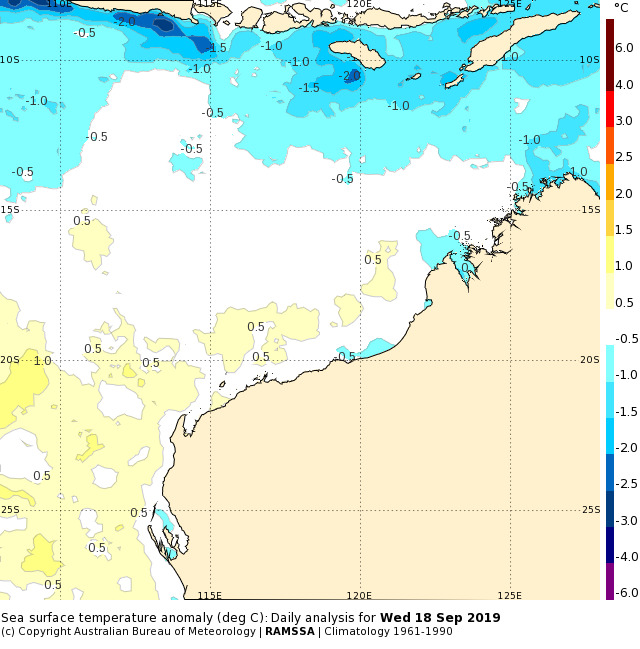
- Dry air cools northern seas
SST Update
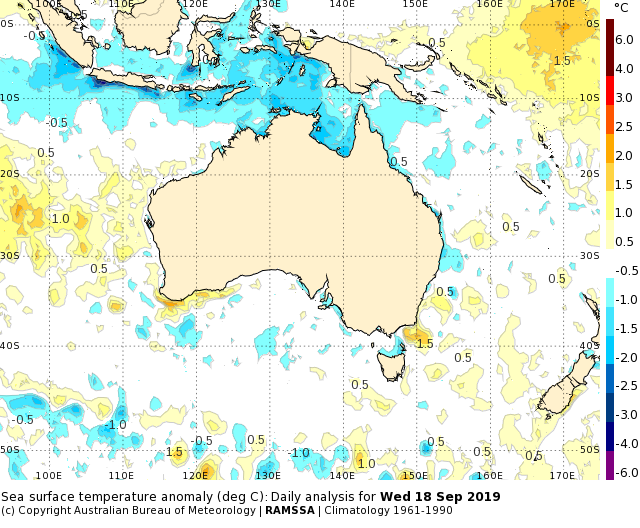
There has been further cooling in northern regions between NT and Papua. Most of the region is now 1.0 to 1.5 deg C below normal.
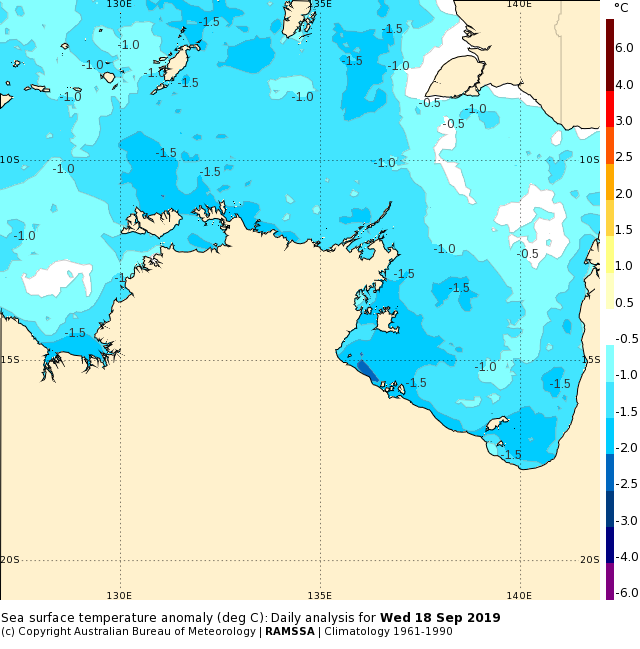
A potential cause of the northern cooling over the last month is very dry air advecting over the area causing large latent heat loss and increased mixing. The atmospheric dewpoints in central Australia and QLD have been very low recently, as low as -10 to -15 deg C. These air masses originated from the cold air outbreaks in southeastern Australia. The air moved up to central eastern parts and dried out there, before being picked up by the trade winds and blown towards the northwest.
The MSLP anomaly chart for August shows higher pressures in central Australia which would have encouraged the advection of dry inland air to northern waters. The 850 hPa wind anomaly also shows the stronger southeasterly winds.
To get a sense of the ‘dryness’ of the air, here is the vapour pressure anomaly for the country in August. Most of Australia has had a negative anomaly (drier air), especially central NSW and southern QLD.
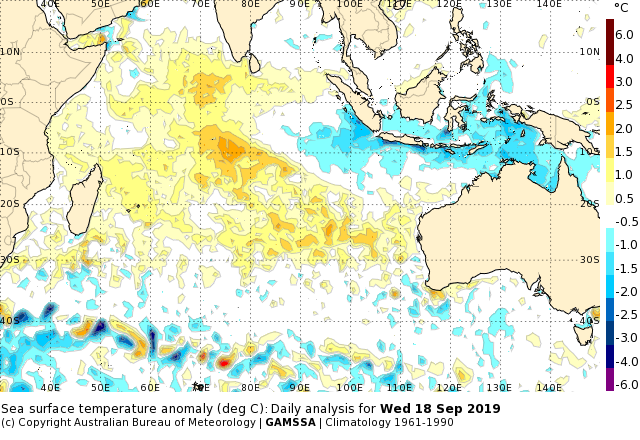
Further west, there has been ocean warming in a broad band between 20 and 30 S in the eastern Indian Ocean.
In fact, the pattern across the Indian Ocean is striking. The 20 to 30 S band off WA connects to a diagonal anomaly towards the northwest of the basin. Near the equator the west-east dipole is obvious and causing the IOD to remain strongly in the positive.
Projections for NSW coastal flooding
How many days of the year will “major” tidal flooding occur in Sydney by 2100 under RCP 8.5 best estimate?
Have a guess.
Some clues: the threshold for major tidal flooding in Sydney is 2.27 m, and the highest tide (astronomical only) is 2.11 m.
Ben Hague at the Bureau has used tide gauge data to calculate the answer using the following methodology:
- Generate predictions using harmonic analysis out to 2100 (without trend).
- Correct predictions so that the mean of predictions is equal to mean of the observations 1985-2006 (This is the baseline period for Climate Change in Australia). The observations include sea level events such as storm surge.
- Use annually resolved projections for Sydney from Climate Change in Australia RCP 8.5 mid-range estimate (77cm rise by 2100) and add the amount specified to the prediction time series.
In a soon-to-be-published paper, Ben reveals the result: 287 days per year.
Flooding almost every day. Perhaps waterside Sydney Harbour will not be quite so desirable an address in the future.
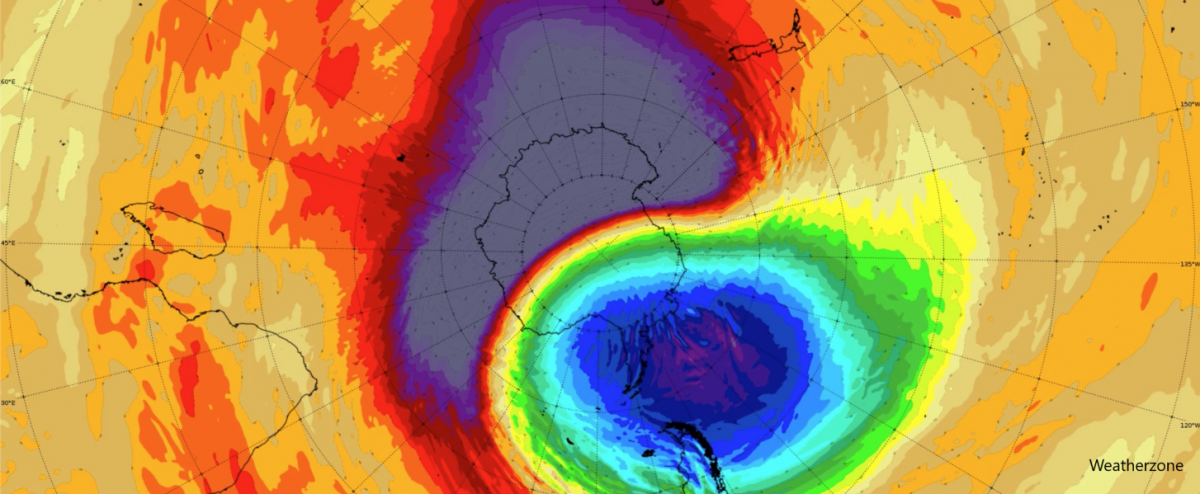
Sudden Stratospheric Warming: ocean impacts
SSW sounds like something out of Armageddon. Earlier this year a SSW event in Northern Europe was called “The Beast from the East”.
Such a beast is happening right now, over Antarctica.
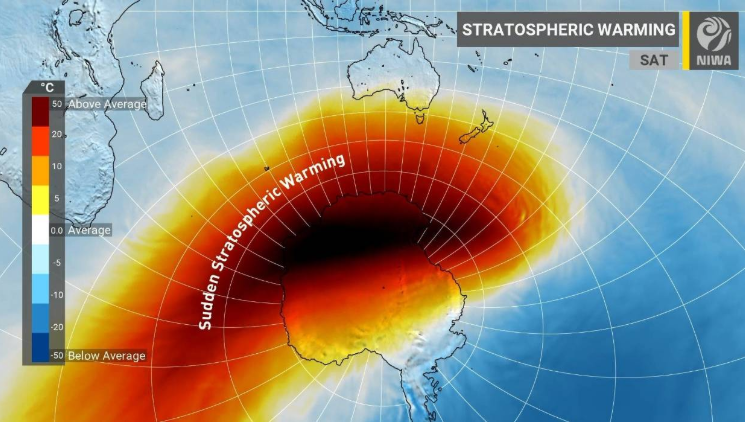
It is related to a warming of the air above the poles, above the troposphere.
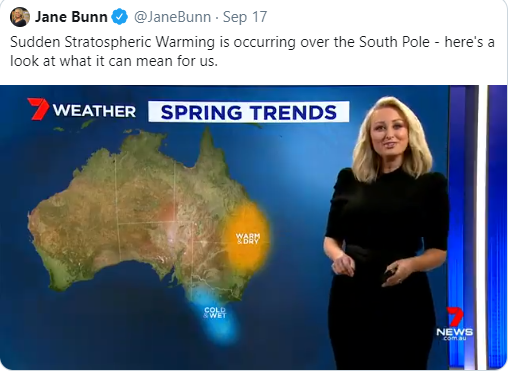
Everybody’s talking about it: Jane Bunn, the Bureau, the ABC, the UK Met Office and many others. It all started with an article out of NZ three weeks ago.
The meteorological drivers are explained in a BOM blog. In essence the upper vortex and winds which typically weaken during spring are breaking down much faster than usual.
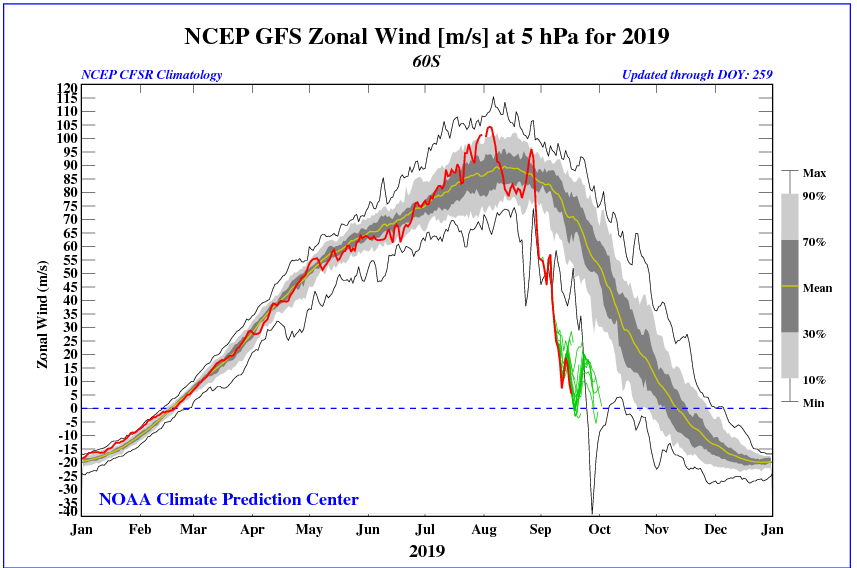
Impacts at the surface are expected between October and January.
How can something 30 to 50 km up in the atmosphere affect the ocean?
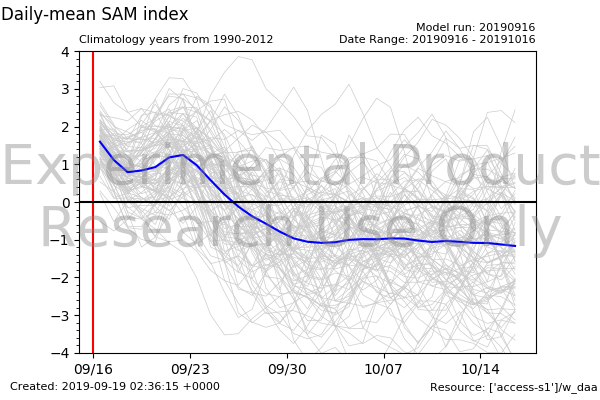
Answer: variations in the stratospheric polar vortex are a key driver of the Southern Annular Mode in austral spring and summer (Wang et al 2019).
For example, in spring 2016 the stratospheric polar vortex weakened and caused low SAM and anomalously weak surface westerly winds near Antarctica. This reduced Ekman transport and coastal upwelling, causing a warming SST along the ice edge. It is thought this mechanism may be behind the rapid decrease in Antarctic sea ice extent in late 2016.
During spring the predictability of SAM is high and this skill has been directly linked to stratospheric anomalies (Seviour 2014). This week’s seasonal forecast does indeed suggest that SAM will go negative by the end of September.
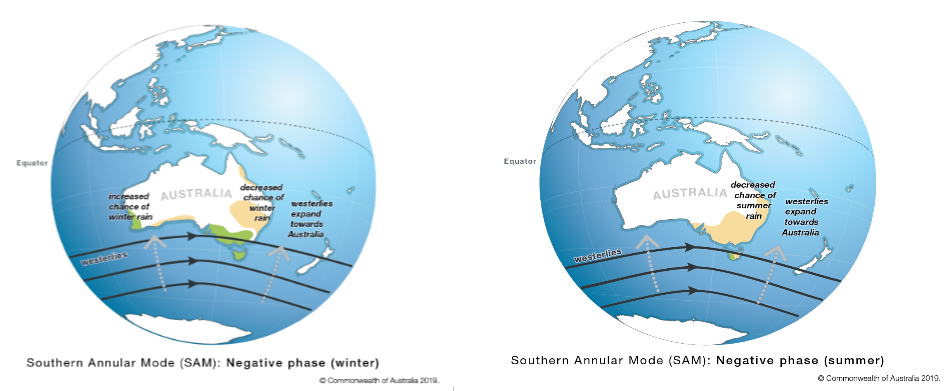
A negative SAM is known for shifting the westerly wind belt further north, impacting the distribution of rainfall across Australia.
But how does the ocean respond?
A paper by Lovenduski and Gruber (2005) used satellite observations to determine the effects of a positive SAM on the Southern Ocean. The correlation coefficients from the study are shown below.
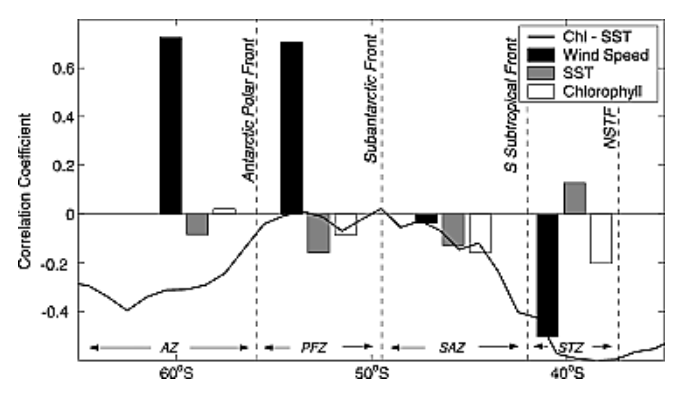
If we invert these results for negative SAM and look in our region near 40 S, we can infer the following effects:
- Increased wind speed (and the deeper winter mixed layers holding on a bit longer into spring)
- Decreased SST (from increased mixing and heat loss)
- Increased chlorophyll.
Are the models picking this up?
The ACCESS-S model does indicate cooler SST in southern Australia for October to December. Further south, a warm SST anomaly is expected to develop closer to Antarctic. This agrees with the study results above.
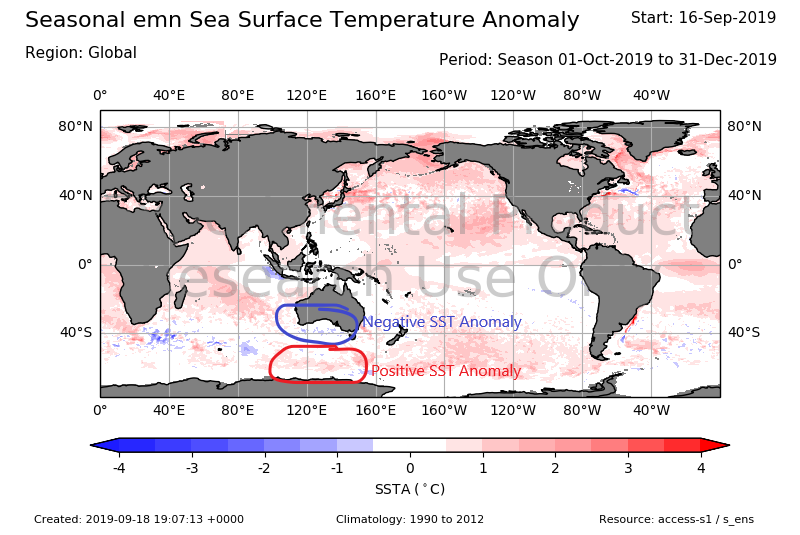
Australia’s southern coastlines will feel the chill from stronger winds and cooler seas . Meanwhile, Antarctic may experience rapid sea ice melt.
From 50 km high to many metres below the sea surface … Sudden Stratospheric Warming will be felt this spring.
Please note: the Ocean Outlook blog will be taking a short break. Next issue will be the 11th of October.
