
- Plan to tow Antarctic icebergs to the Middle East
- Typhoon Krosa leaves a ‘hole’ in the North Pacific
- Indonesian upwelling moves into IOD box
SST update
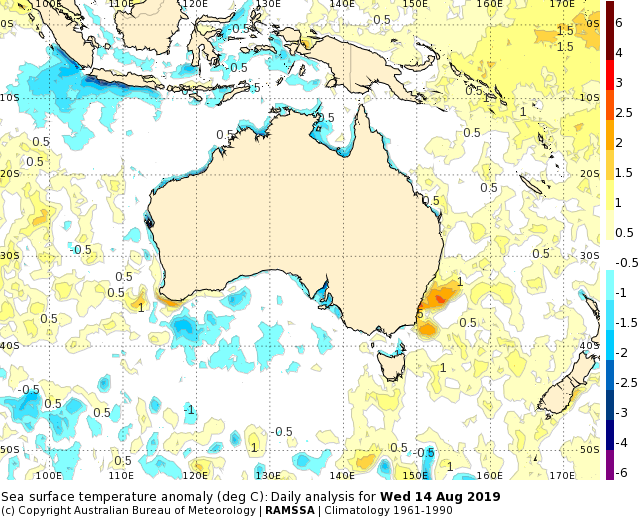
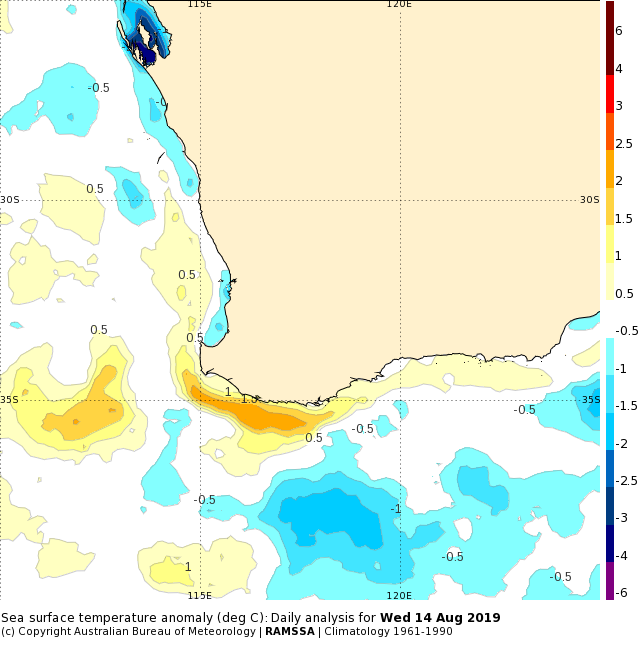
A strong warm anomaly has developed on the southwest corner of WA at about 2.5 degrees above normal. This is likely due to a push of the Leeuwin Current.
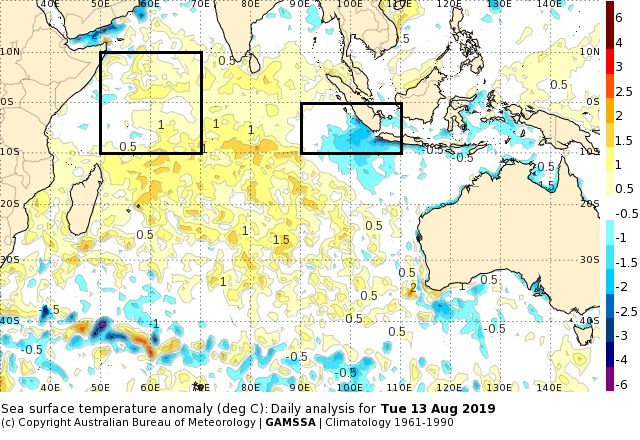
Further afield, the upwelling region in Indonesia has shifted westward to southern Sumatra. This is linked to a seasonal veering in the trade wind direction which is now blowing more from a southeast direction.
This has put the cool anomalies firmly in the eastern IOD box.
Compare the latest daily anomaly below, to what we saw a month ago.
The IOD index has jumped from 0.51 to 0.86 in a week (5th to 11th August). We haven’t seen a value this high since September last year.
The sudden jump is in line with the seasonal forecasts for a strong positive IOD event this spring.
Typhoon Krosa’s cold wake
Typhoon Krosa formed in the North Pacific last weekend. For four days the system wobbled over a particular spot before heading north to Japan.

When a cyclone moves slowly there is a concentration of mixing, upwelling and latent heat loss that causes SSTs to drop dramatically. In this case the cold wake effect was huge, and has even generated some social media interest.
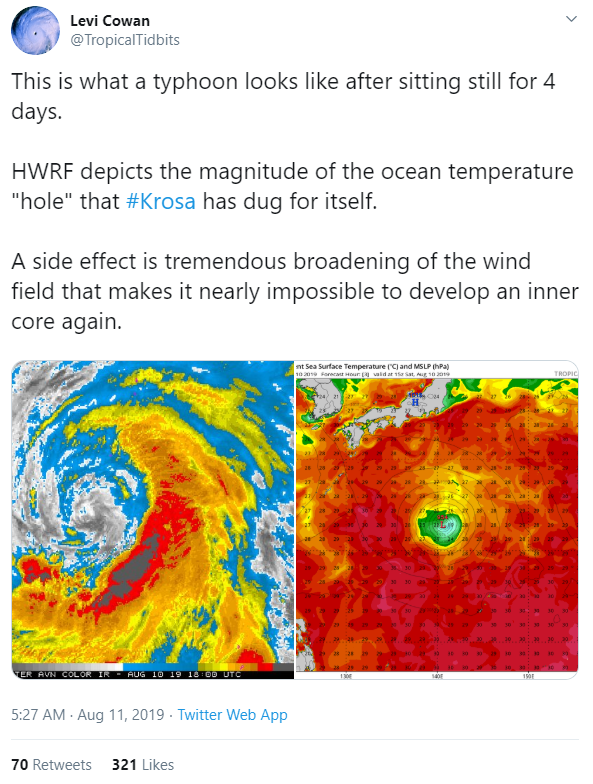
SSTs cooled from 31 to 24 deg C, or even lower. The tweet above shows an output of HWRF – a high-resolution movable-domain hurricane model. In that figure the SST cooled to 19 deg C! Since then the forecast numbers have been more moderate at 24 deg C.
Let’s compare HWRF to OceanMAPS.
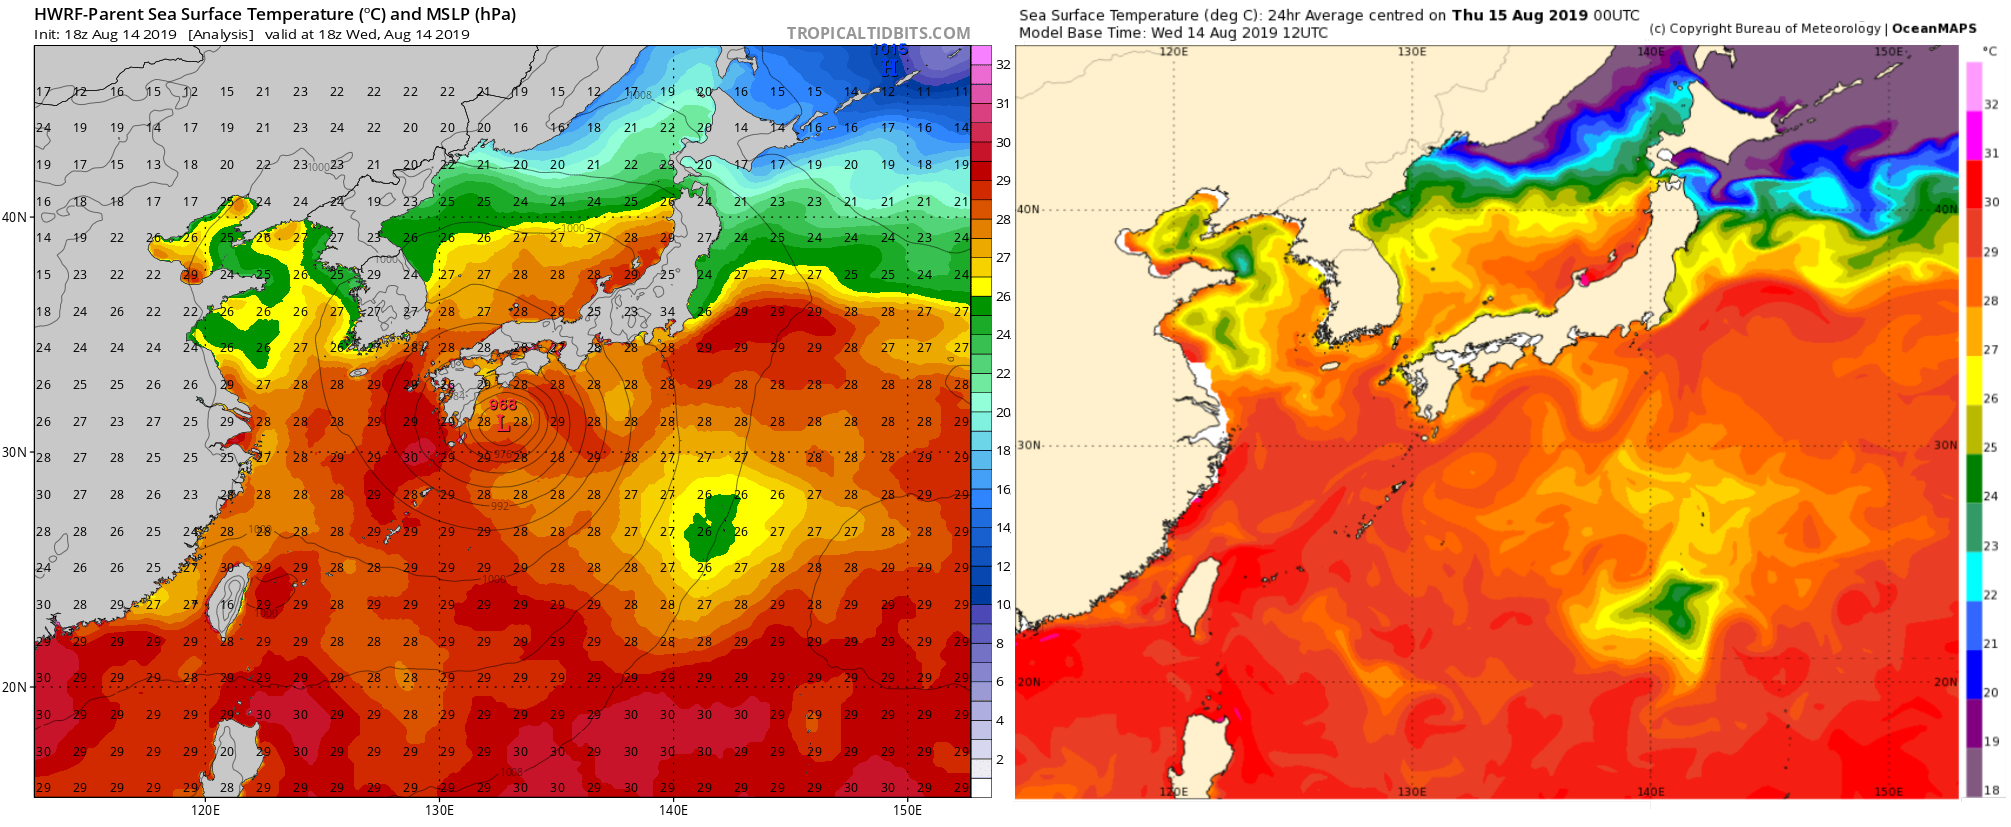
Both have a strong feature in the wake of the typhoon. Both have the cold patch: HWRF at 25 deg C, OceanMAPS at 23.4 deg C. But they are in different locations.
OceanMAPS has the cool patch at 23 N 141 E, HWRF has it at 26.6 N 142 E. That’s about 400 km apart. To be fair, the HWRF forecast has been jumping around a bit. The run on the 10th of August had the cool patch closer to the OceanMAPS location. But let’s look at the latest runs.
Which one is right? We don’t have any insitu observations there at the moment, but we can look at independent SST analysis product such as the Bureau’s GAMSSA.
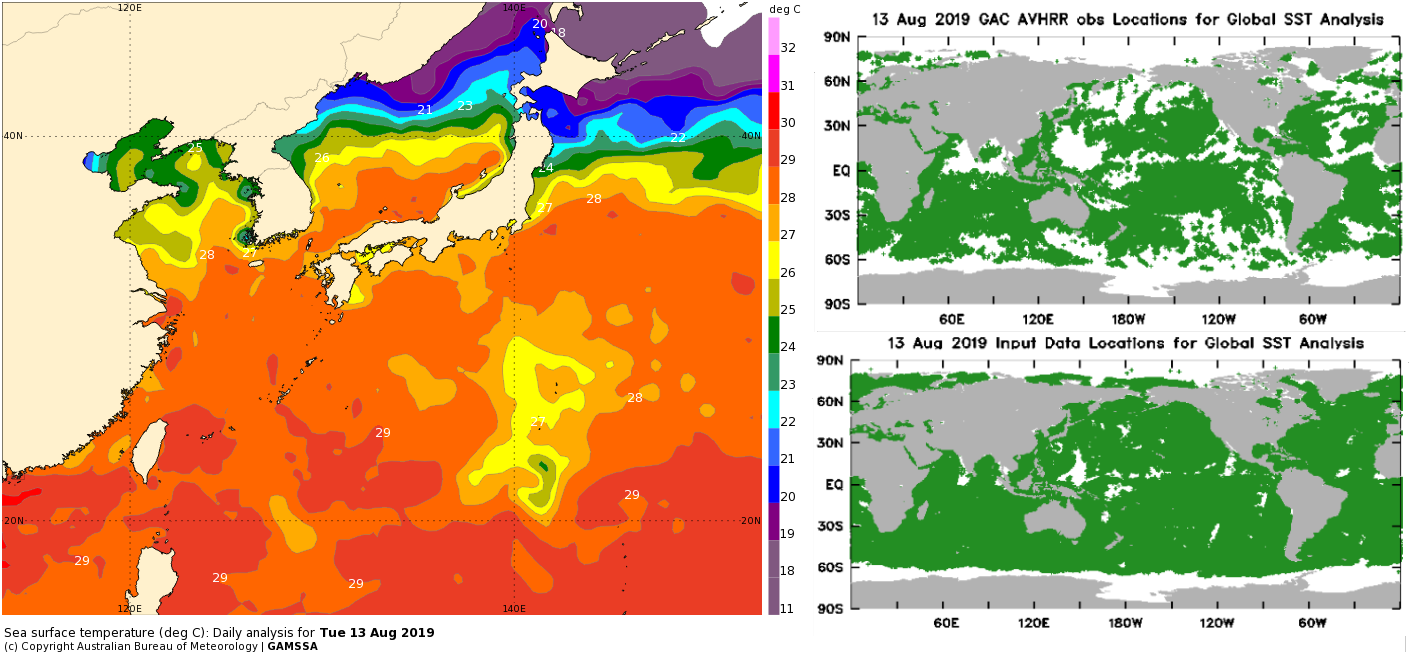
The observation coverage from the infrared sensor (AVHRR) shows a big gap south of Japan. However, other satellite observations from microwave platforms did cover the area so we can assume reasonable representation of the feature.
And the award for the correct location of maximum cooling goes to … OceanMAPS!
So far so good. What will the feature look like 7 days from now?
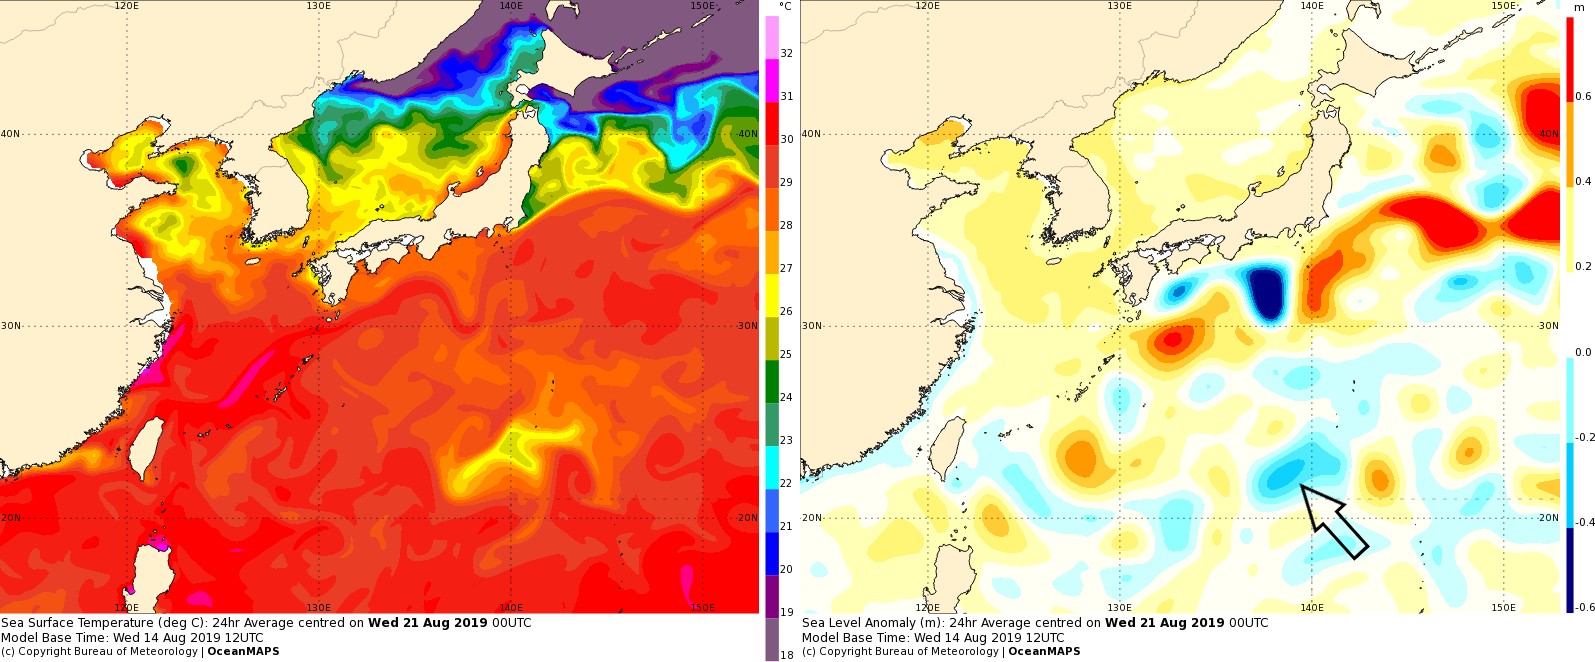
The SST forecast shows warming. This is probably due to a warm cap forming over the top of the cold patch, and the entrainment of warmer surrounding waters.
The sea level anomaly will remain at about -0.4 m: a cold-core eddy that will travel westward, similar to the TC Oma eddy that we’ve seen off QLD. This sea level anomaly is strong but is dwarfed in comparison to a cold eddy in the stream of the Kuroshio on Japan’s south coast (SLA of -0.9 m).
Thousands of miles from anywhere, being slowly covered up at the surface, this spectacular cool patch is likely to fade from the world’s view.
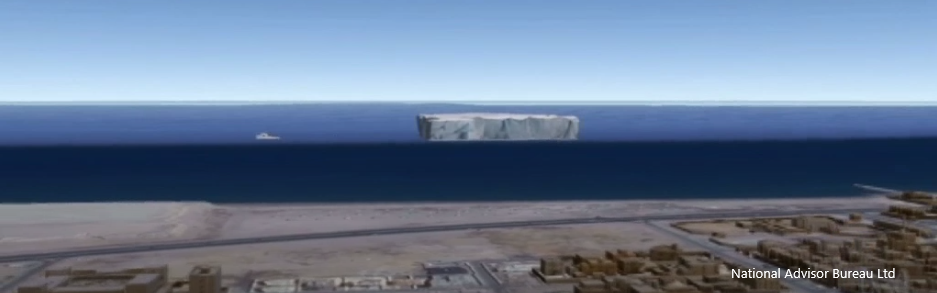
UAE iceberg delivery service using ocean currents
The National Advisor Bureau (NAB) in the UAE are considering towing icebergs to the Persian Gulf in order to boost water supplies. The wild idea has been around since the 1950s, but a formal plan was announced in 2017.
Media interest has surged as the UAE ramps up efforts to complete a test run that involves towing an iceberg from Australia’s Heard Island to Perth. Originally scheduled for this year it has been pushed back to early 2021.
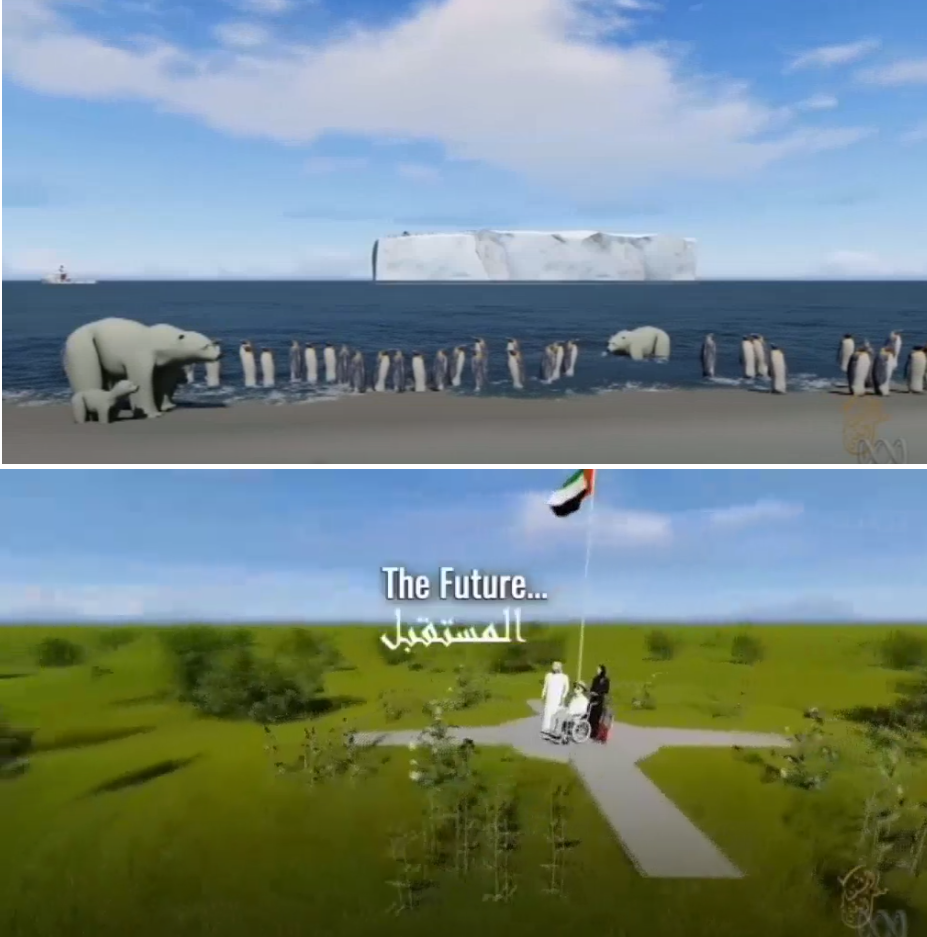
Can someone just take an iceberg? Maybe, with approvals. Icebergs aren’t regulated north of 60 S, but an environmental assessments would need to be conducted. Not least because of the possible impact on wildlife. (A promotional video shows the iceberg arriving in the UAE with penguins and polar bears on top). AMSA have said that a towing plan would need to be submitted if it is to be taken to Australia.
The ultimate plan is to transport the icebergs 4850 nm to the Emirates. At least thirty percent of the iceberg’s mass is expected to be lost in the tow. If the iceberg can move at 1 knot, it will take about 200 days to get to the UAE.
Some of the NAB’s claims include that an iceberg will create a micro-climate that encourages rain and bring the “ancient greenery” back to the desert; and that water from a 2 km by 500 m iceberg could sustain 1 million people for 5 years.
icebergs and ocean currents
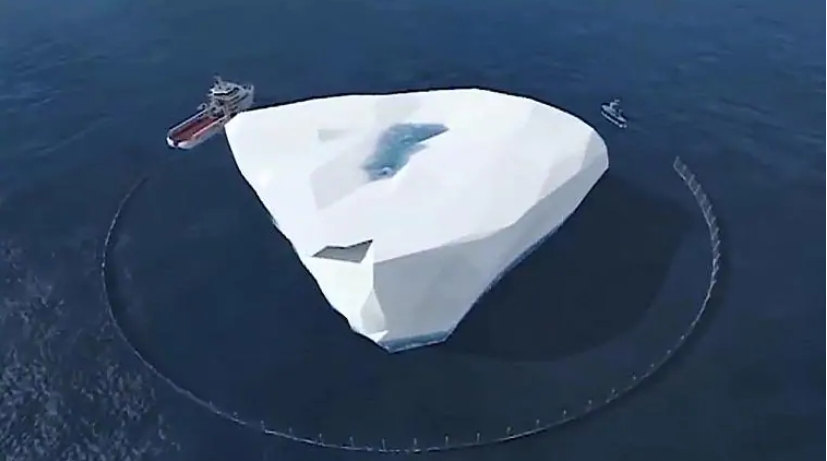
The National Advisor Bureau says that the icebergs will be “guided by barges and moved by ocean currents”.
Icebergs already break off and float for thousands of kilometres north of Antarctica on ocean currents.
No vessel in the world could tow it; we are talking about millions of tonnes here.
So we will be utilising the ocean current to help us move these gigantic icebergs.” – Mr Alshehi, NAB
Let’s have a look at these claims.
Yes, icebergs break off from Antarctica and drift for 1000s of kilometres. But do they really drift in the right direction?
A study by Wagner et al (2017) investigated a well-used rule of thumb that icebergs drift at 2% of the wind speed relative to the ocean current. They found that this only applies for small icebergs (L<200 m) and strong winds. eg. A wind speed of 30 knots (fairly typical in the Southern Ocean) with no currents, would cause a small iceberg to move at 0.6 knots. The direction that the iceberg moves is also wind speed dependent, the stronger the wind the more it moves with the wind. Weak winds can cause a direction difference of 90 degrees due to the Coriolis effect.
However, large icebergs are not affected by wind, only by current.
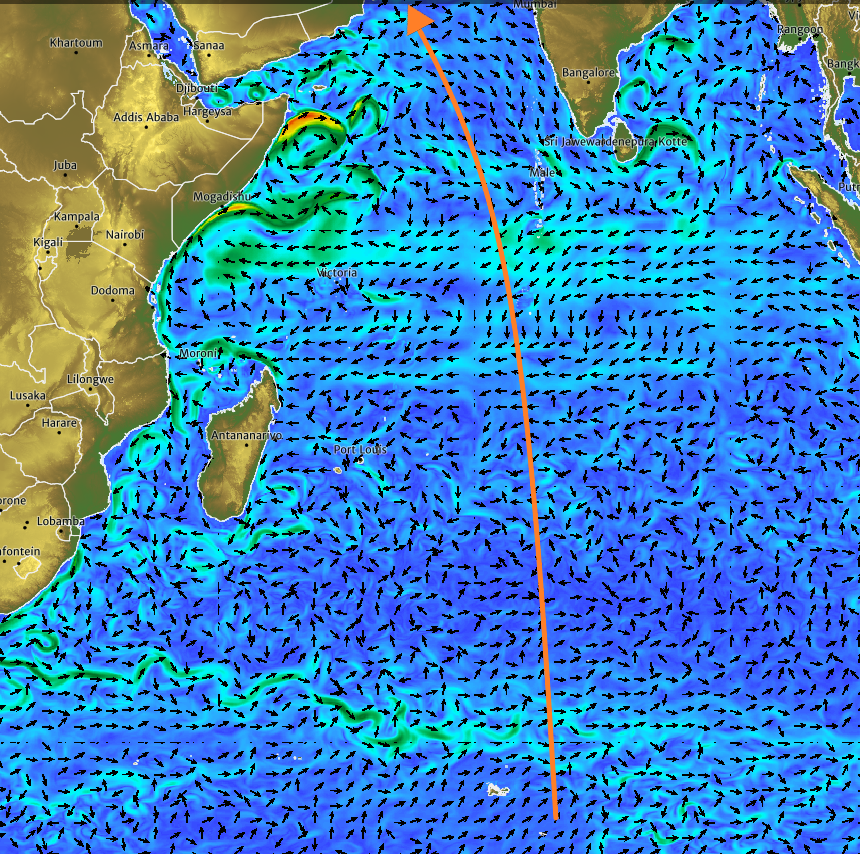
Assuming the Emiratis are interested in large icebergs only, can the currents alone get the icebergs up to the Gulf?
The OceanMAPS velocity forecast for today is shown below. I don’t see too many arrows pointing in the same direction as the iceberg route.
Bruno Spandonide (2012) studied the feasibility of towing large tabular icebergs to Australia. He found that icebergs drift northward until they get to the Antarctic Circumpolar Current, then they tend to break up and melt due to ocean temperatures and wave action. His conclusion was that it wouldn’t be viable to tow icebergs as far as as Australia. A better plan would be to capture the icebergs near 60 S, tow the icebergs to the warmer currents (ACC), melt the icebergs in-situ and transport the melted water in waterbags propelled by kites.
The fact that nobody has been able to do tow a large enough iceberg before is not deterring the interest and research in such ideas.
When the Bluelink partnership develops a sea ice forecasting capability in the next few years, we may have some unexpected customers … from the iceberg harvesting industry.
