
- Bleaching at Lord Howe
- Tasman MHW breaks new record while WA waters go back to normal
- Marine debris season begins
SST update

tasman sea
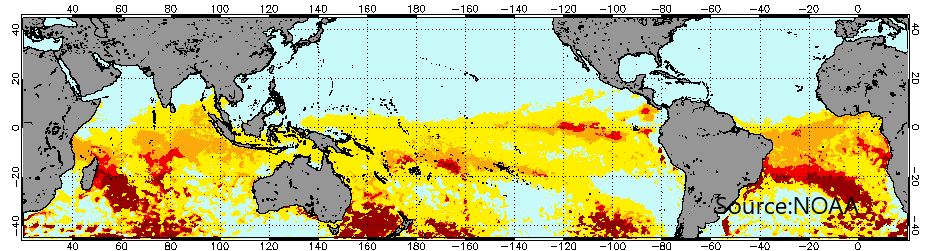
The Tasman Sea marine heatwave this year is worse than the record-breaking MHW last year. According to the ERSSTv5 analysis, SSTs between January to March 2019 have just eclipsed the same period in 2018.

Last year’s MHW triggered widespread alarm including a Special Climate Statement . This year’s MHW arrived a little later (late December) and although it has caused concern, the overall magnitude was assumed to be weaker. The latest figures prove this is not the case.

The warmest area of the Tasman has been further west than last time: much closer to the Australian coast.
In an attempt to look for any positives in an otherwise dire pattern, there has been a slight ease in the SST anomalies due to a strong cold front last week. Some anomalies in the southwestern Tasman have dropped a little from 2 – 3 deg C to 1 – 2 deg C. At least at the surface. As we saw last week, the heat at depths of 40 to 60 m is likely to remain for some time to come.

western australia
On the other side of the country, sea temperatures are getting back to normal. There have been persistent negative anomalies in WA since August last year and the cool waters continued throughout the summer (see DJF image below), but now it is starting to warm up.

There are various possible reasons for the cool temperatures. The surface waters first cooled off southwest WA in August after a series of cold fronts caused strong mixing and large latent heat loss. However it was the persistence and spread of the cool waters that was interesting. Studies have linked the Nino3.4 Index to the strength of the Leeuwin Current. A weak El Nino signal since May 2018 may have led to reduced sea level heights in the western Pacific, causing a weaker Indonesian Throughflow and Leeuwin Current. This would have reduced the heat transport along the WA coast and caused a negative SST anomaly. Another possible factor – upwelling – seems unlikely due to a lack of clear signal in the MSLP and surface wind anomalies.
[If you have any ideas on the cause of the cool waters, please leave a comment.]
Looking ahead, in the next month or so we can expect the Leeuwin Current to strengthen to its annual maximum and this should bring some extra warmth. In fact, ACCESS-S outlooks suggest the anomaly will flip over into weakly positive in the winter months. Especially after the Leeuwin Current eddy spawning season in June.

Coral Bleaching at Lord Howe Island

The Tasman Sea marine heat wave has at least one victim: the southernmost coral reef in the world. Up to 95 % of Lord Howe Island’s reefs within inshore lagoons have experienced bleaching since January this year. The bleaching threshold is 25 deg C. The damage is not evenly distributed. Corals on the outer reefs have been largely spared. But even so, this is a worrying occurrence at the UNESCO World Heritage Site.
It is the third recorded bleaching event here: 1998, 2010 and now 2019.

A timeseries of temperature over the past year shows that even small exceedences above the threshold add up over time. Cumulative heat is measured in Degree Heating Weeks and has exceeded 8 weeks which is a tipping point for heat stress on coral.

You would expect that the heat will ease away as we move into autumn. In OceanMAPS the 95th percentile exceedence images show a stark contrast between the conditions in early February and those two months later. It suggests that the worst is past.

However, NOAA’s Coral Reef Watch shows a less promising forecast. Using the 0.5 degree full-coupled CFSv2 forecast, the Coral Reef Watch indicates the Lord Howe Island area reverting to Alert Level 2 in weeks 5 to 12.
Alert Level 2 is triggered when the ‘HotSpot’ heat stress is greater than 1 deg C and the DHWs exceed 8 weeks. In this case mortality is likely.

The alert calculation uses the 90th percentile forecast from CFSv2 ensemble to calculate the maximum within an area surrounding the island. The area chosen for the nowcast is the thick black line in the image above. For the longer term outlooks of more than 4 weeks ahead, the whole map region is used.
The extended area is designed to:
help coral reef managers understand the extent of potentially approaching offshore thermal stress, with increased projection uncertainty factored in over longer time scales – NOAA
More details on the calculations can be found here.
The BOM’s Coral Bleaching product works differently: it shows ensemble mean SST anomalies, rather than heat stress. The pattern of warm water is is in different location to NOAA but the persistent heat within the broader area is the same. The ACCESS-S images show the strong positive anomalies decreasing as late as August!

Even if the Tasman cools and remains so into next summer, the knock-on effects of bleaching can last well beyond the temperature extremes. In a recent article, it has been shown that the number of ‘baby coral’ in the Great Barrier Reef has dropped by 90% due to bleaching events two years ago.
The Season of Debris
In North-East Arnhem Land a monster ghost net has washed ashore, marking the start of what is becoming known as the marine debris season.

During the dry season, rangers find tonnes of plastic and fishing nets along the Gulf of Carpentaria coastline. As described in last year’s post this is blamed on Indonesian debris being swept into the Gulf during the wet season. Then when the southeasterly winds of the dry season commence, the rubbish is then blown onto the Arnhem coastline.
Estimates suggest there is 1 tonne of waste per kilometre of beach. The ghost nets are particularly worrying as they cause the injury and death of thousands of turtles.
A look at the OceanMAPS surface current forecast shows a clockwise current in the Gulf.

What is driving this?
The northern wet season is barely over (usually Oct-Apr), but the monsoon trough has already moved north towards 10 S and easterly winds have been dominating the region since last week. See lefthand image below. The winds may be causing Ekman transport to move southwestward in the Gulf that would then turn northwestward due to the bathymetry.
The second driver is geostrophy. A lower sea level anomaly is seen in the northern part of the Gulf (righthand image), while the southern part has elevated mean sea levels. This would generate a clockwise flowing current.

Rangers in the southern Gulf are dealing with the aftermath of TC Trevor, but now the busy season has begun for the rangers further north in Arnhem Land. They will have their work cut out for them for the next few weeks and months as the marine debris season gets into full swing.
