
- Tasman temps climb higher towards a MHW
- ‘Icecream headaches’ at NSW beaches
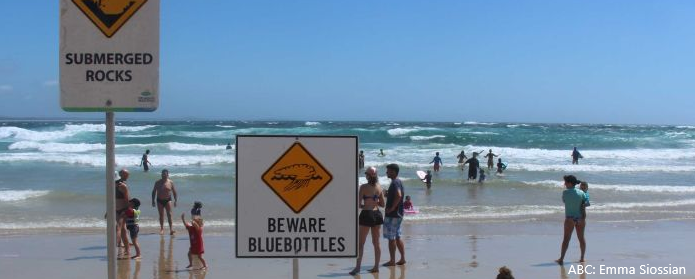
- Bluebottles blown onshore in QLD
SST
SSTs continue to rise sharply in the southeast. Positive anomalies are up to 2 to 3 deg C ad stretch from Victoria to New Zealand. They have increased further since we flagged the possible event last week.
The most concerning aspect is that the anomaly pattern is similar to that of November 2017 – the start of the Marine Heatwave (MHW) event last summer.


The significance of the anomaly is not dependent on SST product or climatological baseline. We have checked. The feature also appears in SST charts from:
- NOAA’s Coral Reef Watch
- BOM’s Weekly Analysis
- GHRSST’s Multi-Product Ensemble
A Marine Heatwave is defined as occurring when:
Seawater temperatures exceed a seasonally-varying threshold (usually the 90th percentile) for at least 5 consecutive days.
Hobday, A. J. et al. (2016)
The OceanMAPS webviewer shows the exceedance against annual percentiles. Comparing the 95th percentile image from last week’s blog to this week (below) we can see how the area of anomalous heat has expanded.

For seasonal percentiles, a good source of information is the IMOS Ocean Current maps which use the SSTAARS daily climatology. These images show that most of the SSTs in the southwestern Tasman Sea have been exceeding the 90th percentile since the 28th of December. That’s 15 consecutive days so far.

In the atmosphere, a large mid-level ridge is expected to dominate the weather patterns over Australia for the next week. In fact, the 500hPa ridge is forecast to stretch northwest to southeast from the Indian Ocean to New Zealand.

BOM forecasters expect this to cause stable weather over the continent, with a large build up of heat in the centre of Australia. It will also block any strong low pressure systems coming through along the south coast.
Over the Tasman Sea we would expect the effects of the ridge to be: lower average wind speeds and reduced cloud cover due to subsidence. All of this suggests that the Tasman is probably in for another week of good solar heating.
In good news, recent runs of the ACCESS-S coupled model suggest that the anomalies should decrease in the late summer.


Let’s see how this MHW develops.
Colder at the beach
Despite the heatwave, water temperatures along the eastern seaboard can be very cool. During NE’ly winds there is frequently upwelling and the SSTs at beaches can drop. This is a frequent occurrence in summer when there is a high pressure system in the Tasman Sea.
Beach-goers have been complaining. The Sydney Morning Herald published an article on upwelling after temps of 17 deg C were observed at Bondi recently.

Another SMH article suggests that ‘Nor Easters’ are becoming more frequent, possibly due to climate change. The writer also blames giant eddies the size of Tasmania for occasional cold spells. The language is dramatic, but it is good that public awareness is increasing.

At the moment it is Crowdy Head that is the chilliest place to go swimming in NSW, with temperatures dipping to 15 to 17 deg C.

Taking a look at the spatial SST plot below, we can see a sharp temperature discontinuity between the cold water inshore and the warm EAC water offshore. Last year Crowdy Head showed huge temperature jumps of 5 degrees in one day when that boundary moved across the buoy location.

Looking at the SST percentiles …

A large section of central NSW is experiencing beach temperatures below the 40th percentile. How much more difficult will that make any communication of a regional marine heatwave? Is it analogous to messages about climate change during a cold snap?
SLA
The EAC region is looking very active at the moment with two large warm eddies that are maxing out the colour scale. The sea level is up to 0.75 m above the average sea surface height. These anomalies are generating strong geostrophic currents of 2 to 3 knots.

The 7 day OceanMAPS forecast seems to show the eddies rotating slowly around the weak cold core eddy between them, with the western warm eddy moving faster as part of the EAC’s main southward push.

The surface temperatures of the two warm eddies are 26 to 27 deg C, but there is also plenty of heat with depth. Vertical profiles of the 90th percentile exceedance shows that the anomalous heat actually peaks at 400 to 600 m deep. These are strong features and we can expect them to stick around for a while.
For more OceanMAPS forecast images, see the BOM website.
Dangerous jellyfish blown onshore
There has been a spike in the number of bluebottle jellyfish stings in QLD, and numbers are also up in NSW. 18,000 stings have been recorded in the last six weeks. That’s three times more than the same time last year.
Stings are extremely painful but rarely life-threatening. However this year the number of hospitalisations is up, and some experts blame a rare and giant version of the species.
However, lifeguards blame strong winds for pushing the creatures onshore. The jellyfish tend to live in armadas out to sea, and have a small crest that acts like a sail. Persistent winds will move vast numbers of them.

Onshore winds for NSW and QLD are common when there is high pressure in the south of the Tasman Sea, like the image below.

So we’ve seen this week that persistent high pressure in the Tasman Sea can result in:
- SSTs warming and the amplification of a MHW.
- Upwelling along the NSW coast and chilly temperatures at the beach.
- A surge in bluebottle stings in QLD.
Perhaps a good ol’ low pressure system is better after all …

IMOS OceanCurrent News also talks about these phenomena in the Tasman Sea.
“Bluebottles, Upwelling and Tasman Sea Warming – that Blocking High is Back.”
http://oceancurrent.imos.org.au/news.php#20190111