
- Theories for standing waves at Manus Island
- Weather patterns linked to SST anomalies
- Spring at Macquarie Island
SST
Recent SST anomaly plots are strong indicators for regional weather patterns this spring.

Waters over the North West Shelf (NWS) are coming back to normal temperatures and show a neutral anomaly. Two weeks ago this water was still cool. It has now warmed rapidly, which is good news (if late in the season) for the development of northwest cloudbands and associated rainfall for southeastern parts of the country. The first northwest cloudband in a long time was observed last week (perhaps the first since late last summer), although there was not much rain in it.

Further afield to the far north west near Indonesia the waters are still cool. A positive Indian Ocean Dipole is developing, with the weekly value at 0.87 C. It will take a few more weeks before an IOD event is considered established.
The image below shows the regions that are used to calculate IOD and ENSO indices. The ‘east’ area for the IOD corresponds well with the area of negative anomaly – far from the Australian coast.
A positive event usually means less rainfall for southeastern Australia. However, can that be balanced out by normal SSTs closer to the coast on the NWS? Would the combined effect mean that northwest cloudbands do develop but are weaker/less moist than usual?


Meanwhile, to the far northeast near the equator there is a large positive anomaly of 1 to 2 degrees C. This heat potential has contributed to a rare early season cyclone. Tropical Cyclone Liua has developed near the Solomon Islands and was named yesterday by the Fiji Met Service. Gale force winds and heavy rain are due to hit several of the Solomon Islands over the weekend with the potential for flooding and property damage.

Backwards trajectories from the cyclone’s circulation indicate that the air mass originated from the area of warm water. See image below. On the 24th of September the air over the Solomon Islands originated from the Coral Sea to the south at 500 to 1000 m AGL. However by the 25th and 26th of September when TC Liua was intensifying, the winds at 500 m originated from surface winds towards the equator near the positive SST anomaly.

Macquarie Island
Spring has sprung at Macquarie Island. SSTs in the area reached a chilly winter minimum of 4.6 deg C in early September. However, temperatures have turned a corner – at least to the west of the island. OceanMAPS shows an intrusion of warmer water from the north.

We can compare sea temperatures from one month ago and see that heat content has increased to the west, even down to depths of 700-800 m.


Wildlife have responded to the change in temperatures and are returning to the island in their millions to raise young. ABC reports that elephant seals have started arriving on the beaches, cormorants are building nests and rare albatross chicks are being born.

While sea temperatures are warming, air temperatures continue very cold by human standards. Daily measurements show maximums of 5 to 7 deg C. The warmest days in September of 6.5 to 7 deg C occurred when the wind direction came from the north or northwest – that is, across that warmer patch of water.
IMOS’s Seal-CTD tracking shows a number of seals clustered at another sub-Antarctic region: the Kerguelen Islands at 50 S 70 E. Unfortunately the seals near Macquarie Island are not showing up on the website; however it does imply that similar seasonal migration is happening in the southern Indian Ocean.

Sea level
Seiching in PNG
Unusual waves of with a long 80-minute period were observed in August at a tide gauge in Manus Island, PNG. It looks like a ‘seiche’ – a standing wave in an enclosed or semi-enclosed body of water. Theories abound.


LCDR Steve Wall and LEUT Scott Baxter have contributed the following:
Scott and I have come up with a theory based on what we think were reefs close offshore to the gauge that potentially at low tide the reefs become exposed and this may set up a standing wave/seiche between the tidal gauge location and the reef leading to the observed effect from the records. It seemed as though the effect occurred as the tidal level neared low tide and then dissipated as the tidal level increased passed a certain threshold. There may be other effects that may mask or degrade the signal at other times. I have attached a (very rough) diagram which I hope explains our theory in some part.

In support of this theory is a CAWCR ‘spectral climatology’ report by Stewart Allen and Diana Greenslade that shows a peak in wave energy at the 80 minute mark for Manus Island using 6-minute data from 2002. This suggests the phenomenon is a regular event that is generated by the unique characteristics of that location.

Does this 80 minute resonance stem from the dimensions of the semi-enclosed lagoon?

Some back of the envelope calculations
On the northern side of Manus Island a string of barrier islands form Seeadler Harbor which stretches for about 75 km. Mariner’s notes (US NGA’s Sailing Directions) state that there is an anchorage area at the eastern end of the harbour that is 15 nautical miles long, 2 to 4 nautical miles wide and dredged to 6.1 to 15.2 m depth. (Area indicated in image above)
Merian’s formula for the longest natural period of a seiche says

Where L is the length, h is the average depth of the body of water, and g is the gravitational constant.
Plugging in L=27.8 km (15 nm), h = 15m, we get T = 4580 s or 76 minutes.
These numbers are encouraging, but also convenient. Different input numbers could have been chosen – perhaps the whole length of the harbour should be included … but without measurements or local knowledge we have no way of knowing where the western-most end of the seiche is. This would tell us the correct length scale.
Similarly, what is the average depth? If the wave gets triggered at low tide, there must be a critical depth.
The mystery of the seiching is open for comment. Do you have any ideas on this strange phenomenon?

Hi Jessica, this TC lies to the south of the large temp anomaly you show above. The region is still positive anomaly. Do you have other evidence indicating this region is a source of air mass?
Interesting point about the air masses involved in TC Liua. I have used the GDAS atmospheric model to calculate backwards trajectories for the area and they show the warm water being a source for the cyclone. I’ve inserted this into the article.
It would be interesting to know if the strong temperature front is also biologically productive. I had a quick look at color imagery and it is pretty patchy. I did a quick search and couldn’t find any indication of shark or whale tracking in the region.
Yes, good question. I was also unable to find evidence of increasing chlorophyll in the area. This article suggests it is generally low in the region: https://www.researchgate.net/figure/Southern-Ocean-chlorophyll-a-composite-map-September-1997-to-September-2007-from_fig1_278023105
However, annual animations suggest that in September there is a southward migration of Chlorophyll in the Southern Ocean. https://earthobservatory.nasa.gov/global-maps/MY1DMM_CHLORA/MYD28M
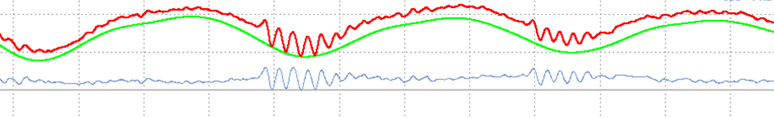
I like the theory from Steve Wall and Scott Baxter but looking at the trace I can still see the 80 min period outside of high tide, admittedly with a lower amplitude.
Here is some food for thought:
If this is seiching based on fixed bounds then we would expect to see slightly longer periods at low tide compared to high tide. Since it is our impression that the effects are largest at low tide we would expect asymmetry in the power spectrum. At first glance the power spectrum looked symmetric but then I realised that it is on a log scale and it is asymmetric, weighted towards higher periods. This supports the premise of seiching based on fixed bounds. I still don’t have a theory for initial setup, as it doesn’t occur at every low tide.