
The OceanMAPS charts on the BOM external website have been updated.
See http://www.bom.gov.au/oceanography/forecasts/ .
Changes include:
- Increased number of map tiles for the larger states of Queensland and Western Australia.
- A new map tile covering eastern Tasmania and the Timor Sea area.
- Currents will now show distance travelled in 12 hours providing more meaningful comparisons.
- Introducing a whole-of-Australia domain,
- Adding another type of chart (for the magnitude of the ocean currents).
The new map tiles greatly improve readability leading to better clarity in interpreting forecasts.

New things to see
The larger images allow easy visualisation of oceanographic features that are represented in the model. Some of these may have been hard to see previously. Examples include:
Coastally-trapped waves across southern states
Sea level anomaly can now be viewed for the whole of Australia.

Fast-moving eddies in EAC
The speed and variability in the East Australian Current eddies can be seen by clicking through the timesteps of the NSW regional tile. This week a warm eddy is expected to move into the shore near Sydney, bringing warmer water with it.


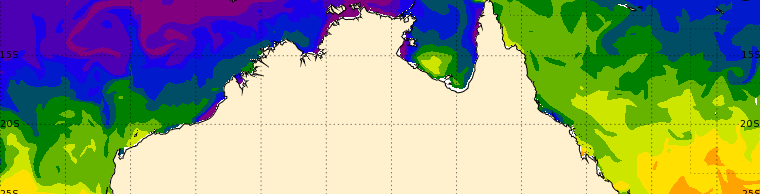
Indonesian Throughflow
The strength of the Indonesian Throughflow is immediately evident when looking at the new Timor regional tile. Current speeds reach 2 to 3 knots either side of the island.
 Ocean currents for Timor Region, forecast for 16th of August – OceanMAPS

This is a great improvement and makes the ocean features so much clearer.