
- Larges waves inbound to the Bight
- South coast bracing for an influx of nurdles
- Cool and dry in the north
SST update

Temperature anomalies remain cool in the north of the country, including the south coast of Java and into the Arafura Sea.
The combination of these cool anomalies, a suppressed MJO (weak Phase 2), and dry subsiding air is leading to a distinct lack of convection north of Australia, even in the mid-afternoon over Indonesia.

Appropriately for this time of year, the convective activity is mostly in the northern hemisphere. The typhoon season has started with the first named system – Typhoon Danas – forming this week. The system was forecast to pass Taiwan late last night (Thursday). Thousands have been evacuated.

The daily SST anomaly product from GAMSSA shows warm anomalies in most areas north of the equator.

Storm inbound
A strong low pressure system is approaching the Great Australian Bight this weekend.

The wave forecasts are huge. The southwestern WA coast is expecting 9 to 10 m significant wave heights with peak periods of 18 seconds. At the centre of the low we could see a Hs of 15 m. The colourbar is off the scale!

How unusual is this?
Let’s look at the AREMI Wave Energy Atlas which uses the CAWCR wave hindcast. The dataset is from a WAVEWATCH III model forced with CFSR winds at 4 arcminute horizontal resolution at the coasts from 1979 onwards.

The return period level plot shows that a Hs value of 10 m is roughly a yearly event. Not so unusual after all.
Now let’s look at a field called the ‘Maximum wave energy period’.

The maximum wave energy period of this location in the whole hindcast is 17 seconds. The 90th percentile is 13 seconds (not shown).
A wave energy period is defined in terms of moments:

It is more easily estimated as Te = 0.857 * Tp
[The calculations in the hindcast are detailed in Hemer at al (2017)].
So if the peak period is 18 seconds (as forecast for 06 UTC on Monday), then
Te = 0.857 * 18 = 15.4 seconds.
Hmmm… that’s big (over the 90th percentile) but its not a record. The Wave Energy Atlas proves a handy way of identifying how extreme events actually are.
Nevertheless, the waves on Monday will be the equivalent to the biggest wave heights of the year at a pretty large wave energy period. It will still be a storm to watch.
Live wave observations at the Albany wave rider buoy can be seen here.
Nurdle invasion imminent
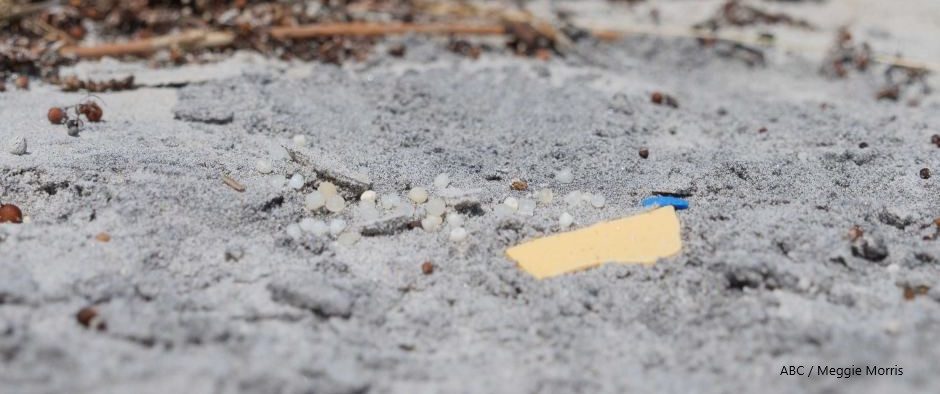
Harriet Paterson, a biological oceanographer at UWA, is combing the beaches of southern WA looking for an influx of nurdles.

Nurdles are tiny pieces of raw plastic the size of a lentil grain. They are used as the basic material for most plastic goods.
During a storm on the 17th of October 2017 a ship in Durban in South Africa lost two containers worth of nurdles overboard. That’s 40 tonnes of the stuff.
A local panicked effort managed to clean up one third of the material, but the rest has drifted out to sea.
That was almost two years ago, so where should the nurdles be now?
An oceanographer based in Durban, Lisa Guastella, has modelled the drift of these tiny particles.
The modelling highlighted southwest WA as a likely hot spot for nurdles to wash ashore. And suggested it would take 500 days for the nurdles to arrive.
In fact, late last year (2018) Dr Paterson initiated “Nurdle November” beach scanning volunteer effort as WA braced for a great nurdle invasion of 1 billion pellets.
However, so far to July 2019, only 8 nurdles from WA beaches have been matched to those lost in Durban.
Only eight. The other thousands of nurdles that have been found could have come from anywhere. In fact, international efforts recognise that this is a global problem.
But is the specifically-identified and hotly-anticipated Durban nurdle invasion still on its way here?
It is likely that this weekend’s storm will bring with it waves of nurdles that will wash ashore to high water points. After the waves subside Dr Paterson will be out there scanning the beaches … hoping to find the Durban debris.
If you have something interesting for the Ocean Outlook blog please get in touch. This could be an observation, a photo, a forecast, or even a wild theory.

Victorian nurdle event Nov 2017:
Link to IMOS article
http://imos.org.au/fileadmin/user_upload/shared/IMOS%20General/documents/newsletters/IMOS_Marine_Matters_Issue_30_WEB.pdf