
- Alarming fall in Antarctic sea ice extent
- The current is keeping Cape Leeuwin warm
- A positive IOD for the rest of the year?
SST update

There has been little change in the broad SST anomaly pattern over the past week, with warm temperatures persisting in the Tasman Sea while cooler waters continue in the southwest and the north.
Indian ocean dipole
Those looking for tropical moisture from the Indian Ocean to form ‘northwest cloudbands’ may have to wait a little longer.
VIC and NSW forecasters are often interested in SST anomalies off WA’s northwest coast. Warm ocean temperatures encourage convection which can link with a passing extratropical cold front and bring rain to the eastern interior.
Last year a positive IOD that developed in September was one of the factors blamed for the NSW droughts.
How are we tracking so far this year?
A weak positive IOD developed last month. And according to the latest BOM outlook we may see some brief dips towards neutral, but the positive IOD pattern is set to continue until December.

In fact the little dip this month was caused by temporary factors that should self-correct:
The latest fall in the IOD values is simply due to average to cooler than average waters right on the African coastline, most likely generated in association with severe tropical cyclone Vayu. – BOM
A positive IOD is often bad news for winter and spring rainfall totals in central and eastern Australia.

If this is the case, Australia’s summer crop harvest may be relying on WA’s growing region which received a deluge of rain this week due to a strong front.
The current around the Cape

There is a warm bath around the southwest corner of WA. A positive SST anomaly of 2.5 deg C has developed this week as the coastal water continues warmer than the expected seasonal cooling.
Inshore, temperatures are a balmy 19 to 20 deg C, yet a few miles further south the temperatures drop to 15 deg C where a negative anomalies have persisted since April.
The Leeuwin Current is at maximum strength at this time of year and is pumping warm warm southward along the coast. The OceanMAPS forecast shows surface speeds of up to 1.5 to 2 knots in places.

Along with the seasonal current, the warm anomaly is also assisted by the recent atmospheric cold fronts, as strong prefrontal northerly winds have encouraged sea level surge and downwelling along the coast.
The past two weeks have seen 3 to 4 events of positive tide residuals. You can see the tide station comparison charts here.
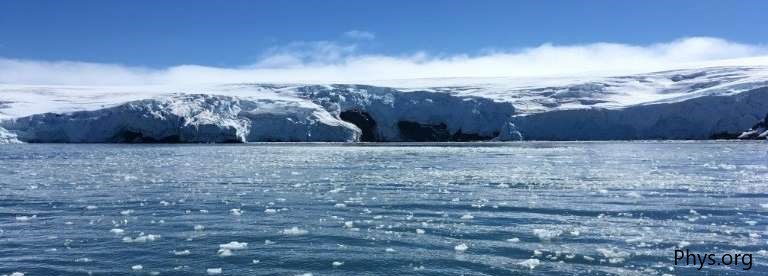
Antarctic sea-ice drops
A recent press release has highlighted an alarming fall in satellite-measured Antarctic sea ice extent since 2014. That year marked a record high, but the following two year ice extent values fell ‘precipitously’ to record lows. In fact the rate of melting was three times as fast as anything seen in the Arctic.


The NASA sea ice analysis this week shows many areas with less ice than the minimum recorded in 2017. However, one larger-than-normal area in the Ross Sea is keeping the total value up.
The current ice extent is 14.1 million km^2, compared to the 2017 minimum of 14.0 million km^2 … hardly a comfortable margin.

The difference between 2014 (max) and 2019 (now) for the 30th of June is 2.5 million km^2. That is equivalent to a third of the size of Australia.
This has generated concern, including this tweet by BOM climatologist Andrew Watkins.
 What really was the cause of the plunge in 2017? Several causes have been put forward:
- A strong northerly wind that caused the Weddell Sea ice to melt,
- The extreme negative SAM in November 2016,
- The extreme El Nino in February 2016,
- A persistent Zonal Wave 3 pattern in the atmospheric circulation, and
- A weak polar stratospheric vortex.
Most researchers point to a combination of these events, suggesting a ‘perfect storm‘ of conditions caused the precipitous melting. For more details, see Parkinson (2019).
Another period of known rapid melting occurred between 1974 and 1977 – however, this was before the passive microwave data record. Some scientists conclude that the Antarctic sea ice is inherently more variable than the steadily declining Arctic sea ice. If so, perhaps trend lines over a 40-year period aren’t sufficient to capture the true trend of the Antarctic.
Time will tell if the sea ice extent will rebound.
Or if this new minimum is the new mean.
—-
What do you think? Please leave a comment below.
