
SST update

tasmania
Tasmania is in a ‘warm bath’ with warmer than normal sea temperatures on both sides of the island. The east-side heat is due to the persistent Tasman Sea marine heat wave, while the west side is affected by the Leeuwin Current extension.

The bath does not help atmospheric conditions. Hobart started autumn with a forecast of 35 deg C and then broke March records with over 38 deg C recorded the following day. In the meantime smoke from numerous bushfires threatens to choke residents and total fire bans are in place. Maybe Tassie will soon lose it’s ‘chilly’ reputation.
NSW beaches
Further up the east coast in NSW the temperatures have actually cooled … or have they? MHL buoys are reporting that the Sydney and Crowdy Head temps have dropped from 25 deg C to only 20 deg C within a couple of days.

Last week the warm EAC water hit the shore and temperatures in NSW climbed. However, in the last few days there has been another bout of upwelling. A narrow sliver of cooler water sits along the shore.

TC potential builds in NW
In perhaps the biggest SST change over the last week, temperatures have warmed rapidly between north WA and Indonesia . A monsoon break has kept skies fairly clear in the area and extended insolation has heated the surface. There is now a large area of 30 to 31 deg C.

Tropical Cyclone Heat Potential values have increased accordingly to around 120 to 150 kg J cm-2. This is a good heat source for a potential cyclone. Tropical Cyclone Heat Potential for WA, black circle showing area of recent increase – OceanMAPS
TC forecasters are on the alert. The latest outlook has a moderate chance of a TC developing on Monday due to favourable conditions including both warm ocean temperatures and low atmospheric shear.


Another factor may also contribute to the risk. The MJO is moving into Phase 4 next week (Maritime Continent). Most ensemble models have the MJO strength decreasing below the unit circle. But if the MJO remains strong, the atmospheric shear remains weak and the ocean remains hot, then we may have the right combination of factors for a cyclone.
Bight-ing hot
The Great Australian Bight has also warmed significantly over the last fortnight. Compare the below plot to the same one two weeks ago.

Alarmingly, much of the coastal water along South Australian is in the top 10th percentile. If we look at the anomalies themselves, we see that the SSTAARS anomalies are at 3 deg C in many places. RAMSSA anomalies are more cautious with 1.5 deg C in the open sea but ramp up to over 3 deg C in the Gulfs.

The heating has developed due to a dominant high-pressure ridge across the south of the country. The image below shows the MSLP anomaly for February. The March numbers are not yet in, but one could expect the ridge axis to have moved further south in recent weeks.

The 4km ROMS model produced for the South Australian Research and Development Institute, known as the SAROM model, shows that temperatures are indeed hot. We can also see that the Gulfs are highly saline.

 Sea surface salinity nowcast – SAROM
The pattern of hot saline water in the Gulfs at the end of summer is not unusual. It is the anomalies of this summer maxima that are the cause for concern.
Further east, an IMOS glider is currently deployed in the vicinity of the Bonney Coast. See the track below. The striking thing is that even in the midst of upwelling, there is a positive sea temperature anomaly of 2 deg C down to a depth of 50 m.

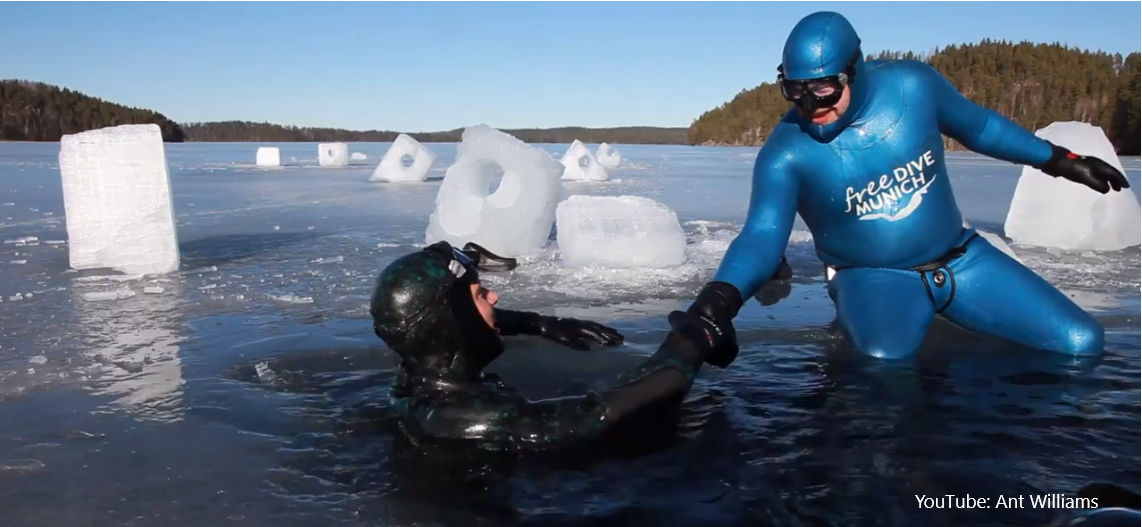
Ice diving
In the next two weeks, an Australian will attempt to break the world record for free diving under ice. Ant Williams from Torquay is hoping to break the record of 65 m. He is aiming for 80 m.
The site of his record attempt will be near Kirkenes in northern Norway where air temperatures will be below -20 deg C. The team will travel on snowmobiles and spend a day cutting through the ice with chainsaws before Ant starts to dive.

Ant’s media releases say that the water will be so cold that his eyeballs would freeze if unprotected, at 0.2 deg C. It will be pitch black after a few metres. After 20 m the air in his lungs and wetsuit will have compressed enough to make him negatively buoyant. He will sink. After 50 m his lungs will be crushed empty and he will start getting contractions in the throat. It will be turning around that is the hard bit – kicking back up to the surface as the body struggles to survive.
So how do these numbers match up to the Bureau’s forecast data for that far away place? Let’s look at the SST analysis for this region.

The numbers show SSTs of 3 to 4 deg C, which is about 1 deg C above normal. Not a good start if you are chasing ice diving.
More generally, where is the ice in the Arctic? Let’s look at the current sea ice extent.


In good news, the sea ice is at its yearly maximum in March.
In bad news, the sea ice a long way away from where Ant Williams wants to make his attempt, and the ice extent is also tracking below the climatological median.
In fact, in recent decades the Barents Sea has warmed dramatically. It has been called the ‘Arctic hotspot’ in an article in Nature.
The northern Barents Sea may soon complete the transition from a cold and stratified Arctic to a warm and well-mixed Atlantic-dominated climate regime – Lind et al, 2018.
With a lack of sea ice in northern Norway and warm SST anomalies everywhere, Ant Williams will have to trek well into the fjords to find some frozen water. It will be slow going. Media articles suggest that he can only travel 10 km per day on a snowmobile.
Once Ant Williams finds a frozen fjord, he can expect to dive down through a very dynamic body of water. Fjords in the region experience intense seasonality which causes strong stratification with depth as described in a paper by Cottier et al (2010). The schematic below is based on fjords in Svalbard (the island well north of the Norway) but similar principles apply for mainland fjords.

The stratification is strongest in the summer, while in late winter the water is better mixed (and very chilly).
How far inland will Ant Williams have to go to get some ice-covered fjord water? You can follow his record attempt here.
