
SST update

The ocean temperatures remain very warm in the north at 29 to 30 deg C across the Top End. A low pressure system in the monsoon trough (now situated across Indonesia) could spin up a tropical cyclone in the northern Arafura Sea on Monday. Cyclone forecasters suggest a formation probability of 15 % and they are watching with interest. Can it happen this late in the season? There is certainly enough heat in the ocean.

Meanwhile ocean temperatures are cooling rapidly in the south of Australia.
In particular the cool anomalies off WA are strengthening. Interesting, temperature anomalies along the Leeuwin Current pathway look neutral but inside that, inshore on western coast, it is at least 1 deg C cooler than normal due to upwelling. Then offshore from the southern coast we see two big areas of cooler water. These patches are 2 to 3 deg C below normal, with a neutral area in between that SLA images suggest is a weak warm eddy.

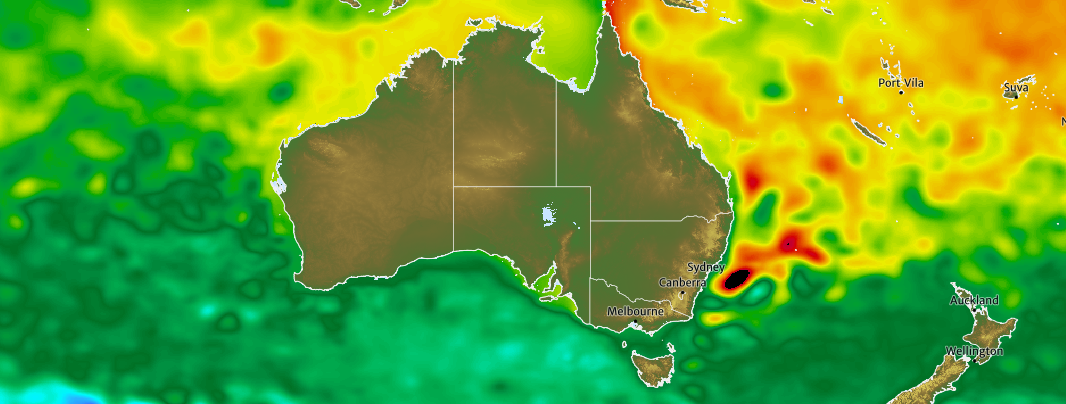
On the east coast of the country, it is very warm off central NSW with 2 deg C anomalies over a large area due to a strong warm eddy. While absolute surface temperatures are cooling – now around 23 to 24 deg C, down from the summer maximum of 27 deg C – the anomaly persists.
NSW beaches are very swimmable. MHL buoys are recording 22 deg C in Sydney.

In contrast, Port Phillip Bay temperatures have started to plunge. Measurements suggest that the water is at 16 deg C, and dropping to under 15 deg C in the middle of the Bay. That is chilly! Swimmers beware. The summer maximum was 22 to 23 deg C in February.

Sea level
The sea level anomaly map of Australia can tell a quite a few stories this week.

Firstly, a large complex low in the Great Australian Bight is causing strong W to SW winds and large Ekman transport into shore. The sea level anomaly exceeds the colourscale which only goes up to 0.3 m. More on this later.
Secondly, a large warm eddy off central NSW is clearly visible in the SLA plot. This is the one holding all the heat and keeping up the SST anomalies. It is the highest SSH anywhere in the country right now – as you can see in this post’s banner image.
You could easily be mistaken in thinking that this NSW eddy has been around all summer. Actually, there has been a series of warm eddies in the last six months. The one currently alongside Sydney was further offshore two months ago (see images in this post). It has since moved westward and displaced the cold eddy which moved further south. Check out today’s NSW SLA forecasts here.
eddies heading west
Another eddy is clearly visible. Further north. TC Oma’s eddy ! This cyclonic feature developed off Vanuatu during TC Oma’s intensification in February and is still alive and strong. The eddy is advecting west. How fast?

On the 21st of February it was at 15 S 164 E. Now on 2nd May it is at 17 S 157 E. Just looking at the westward component at the moment, we can see:
7 degrees in 70 days = 751 km / 1680 hours = 0.45 km/hr (0.24 knots).
This phase speed is equivalent to 12 cm/s which is consistent with studies of eddy movement at 15 degrees latitude. (eg. Barron et al 2009).
Assuming the speed is constant and it continues slightly southward towards Bowen, then the eddy has 9 deg of longitude to go.
ETA landfall = 9 degrees at 0.45 km/hr = 966 km/0.45 km/hr = 2161 hrs = 90 days.
Forecast arrival time is the 31st of July.
This will be a late realisation of the prophecy of the clairvoyant David Griffin from CSIRO who said:
“A strong cyclonic (cold core) eddy will hit the Northern Great Barrier Reef in June this year.”
Will the speed be constant? Or will it change if the eddy moves further south to a different latitude? It may actually slow down. Studies suggest that eddies can ride Rossby waves (Polito and Sato 2015), and the Rossby wave phase speed which is latitude dependent does impact eddies (Zhang et al 2016).
What about direction? As we saw with the Leeuwin Current eddies last year, cyclonic eddies tend poleward as they travel so this southward component should continue.

Meanwhile, TC Veronica’s cold eddy is moving westward into the Indian Ocean.
On 31st March it was centred at 17 S 116 E.
Now, on the 2nd of May, it is at 18 S 114 E.
That’s 212 km over 32 days = 0.27 km/hr of westward speed.
This system is weaker and smaller, but if it maintains its form as far as South Africa at 32 E, then it needs to travel 8387 km which will take approximately 1294 days = 3.5 years. Perhaps we won’t be looking when this eddy makes landfall … but I sincerely hope it does.
Sea level surge in SA
A strong low pressure system in the Bight is causing a surge in sea level along the southern coast. OceanMAPS suggests a surge of over half a metre!

Aggregate sea level forecasts indicate that HAT will be exceeded in the next few days for many southern locations. Luckily, it is neap tides at the moment (see difference between light green line and the blue lines of the total sea level ensemble below). If it was spring tides we would see some local inundation.

The extra water level can be clearly seen in other storm surge forecast information too.
Firstly, let’s look at the National Storm Surge model timeseries for Cape Jervis, below. This model uses gridded tides without bias correction, so the absolute values for sea level aren’t perfect. However, the surge is driven by ACCESS-R which has greater resolution that ACCESS-G which drives OceanMAPS. Also, it provides wave setup information. We can pay attention to the anomalies.
This timeseries below predicts just over 0.6 m of anomalous sea level, ie ‘surge’, with 0.3 m of wave setup in the early hours of the 2nd of May.

The National Tidal Centre observations for Cape Jervis are fully calibrated. The measured timeseries below shows that the sea level residual did reach approximately 0.6 m in the early hours of the 2nd of May.

It is nice when forecasts all match up. At least it didn’t match up with spring tides.
Why does sea level matter in SA?
A particularly concerned customer is SA Water who control the sea barriers at Goolwa, just to the northeast of Cape Jervis. The barriers are designed to protect the estuary from excess salinity. After all, this is the mouth of the Murray-Darling basin. Barrages have been in place since 1934.


The lower lakes were predominantly fresh prior to European settlement. However, with ecological changes such as reduced water flow due to irrigation upstream, storm surges of saltwater now can have a big impact on the area.
There is not just one barrier, but a series of 593 water gates to make a total barrier of 7.6 km long. They are designed to maintain the water levels of the Lower Lakes and prevent too much salinity affecting pastoral areas (Murray-Darling Basin Authority).

The BOM sends customised daily forecasts to the managers of SA Water. These include wind, waves and sea level. A section of the forecast is shown below.

These numbers help the operators decide whether to close the gates. We don’t know if they closed the gates this week. I have heard that they are more responsive to closing the gates on weekdays. If a large storm surge happens on a weekend then let’s hope the long range forecasts are good and there is plenty of warning.
