

- Can Machine Learning predict the ocean?
- Blue economy and “marine sprawl”
- EAC waters extending southward
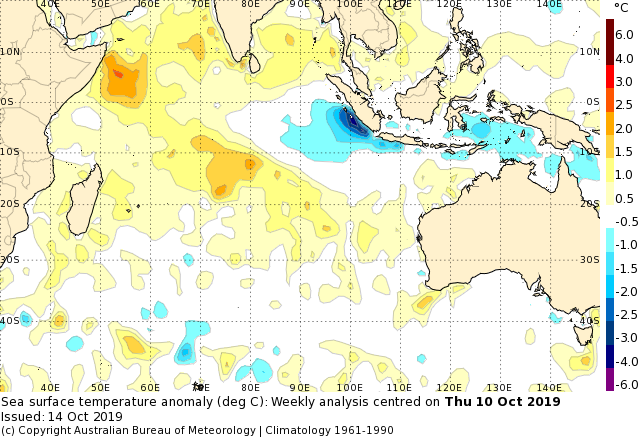
SST update
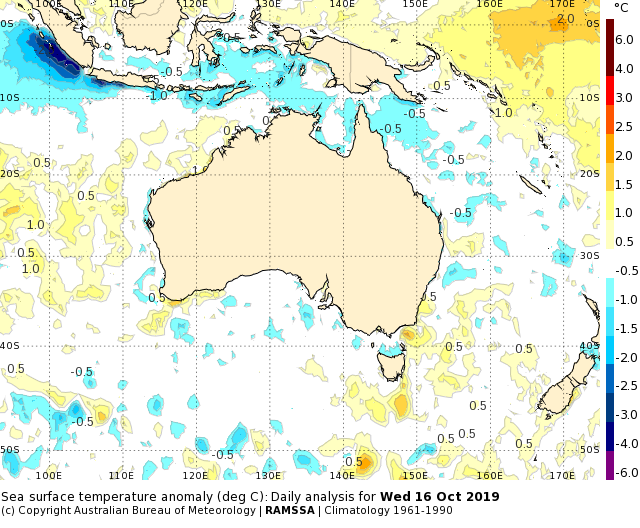
In Australia’s southeast we can see some subtle changes in the SST anomalies. A warm patch that was east of Bass Strait is now further west, intruding into the Strait. There is an area of 1.5 to 2 deg C above normal south of Lakes Entrance.
Meanwhile, to the far south of Tasmania we can see a broad region of 1 to 1.5 deg C positive anomalies.
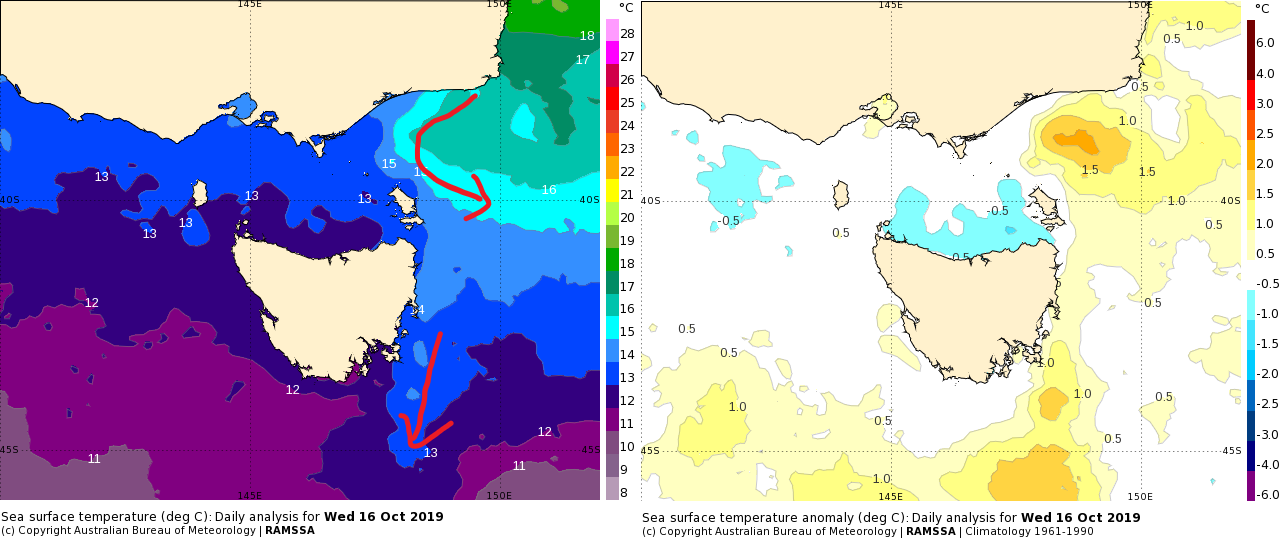
If we look at the absolute temperatures we can see what is driving it.
Surface warm water from the warm East Australian Current water has moved westward and is now intruding towards Lake Entrance. The main warm core eddy, with heat at depth, sits further east (see SLA image).
Meanwhile the western and central parts of Bass Strait have much cooler water more characteristics of the southern coastline, and with a slight negative anomaly. A strong temperature gradient has established around eastern Gippsland.
Further south, to the south of Tasmania we can see the tail of the East Australian Current pushing into the cold 10 to 11 deg C Southern Ocean water.
We know that the climate trend is for the EAC to push further south over time. In a 2007 study, Ken Ridgway found that from 1944 to 2002 the EAC advanced poleward by approximately 350 km.
In this context, and given the use of a 1961-1990 baseline climatology in the Bureau products, the warm anomalies south of Tasmania are not a surprise. However, even against the SSTAARS climatology of 1992 to 2016 the SST is still in the top decile. The warm anomaly is real.
Further afield the Indian Ocean Dipole is still on a growth spurt. The latest weekly value is 2.15! This is a new record since at least 2001, possibly 1997.
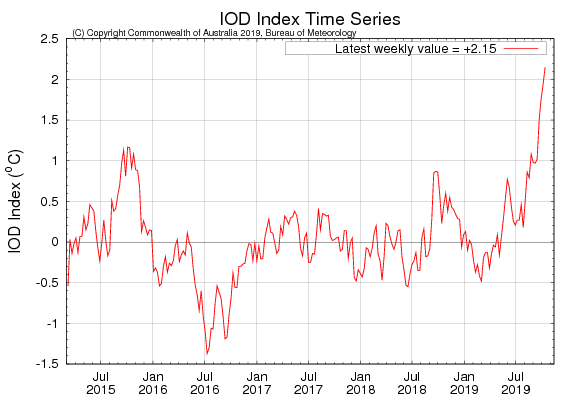
The SST anomaly chart shows a striking pattern. For more details see the latest ENSO Wrap Up.
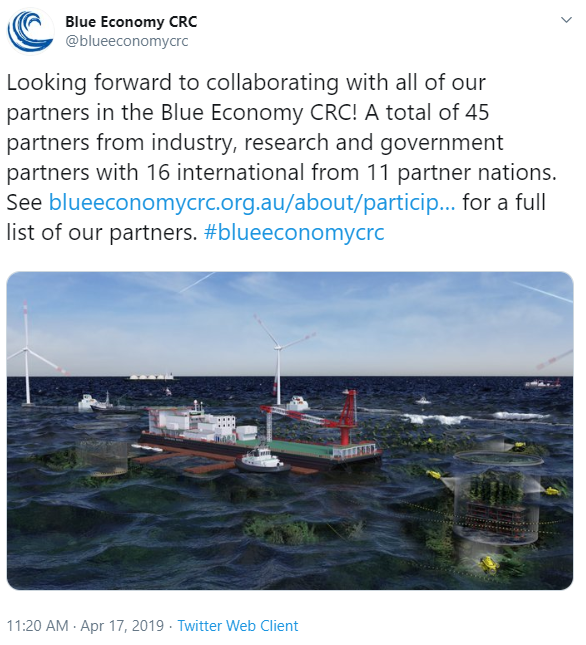
The Blue Economy and “marine sprawl”
The “Blue Economy” is a buzzword gathering increasing attention globally, as resources on land are reaching their limits.
This year’s Australian Marine Science Association conference was titled ‘Marine Science for the Blue Economy’. There is also a newly established Blue Economy Cooperative Research Centre, aiming to find scientific solution for sustainable seafood and energy production in offshore waters.
But what is the Blue Economy?
The term is as hard to compress as the ocean itself. (Pun intended).
It has been applied from things ranging between giant floating fish farms to artificial islands to ocean-floor mining.
A recent article by the ABC uses the term to describe a Dutch marine architect’s plans for a floating Olympics. The stadium barges could be towed from country to country between events. Koen Olthuis also believes that the ocean is not the enemy of the people, but an opportunity, and populations should start to be housed on top of the water in floating apartment blocks.
Green spaces could also be created over the water, such as a proposed Sea Tree. These could “provide habitats for animals which can’t be disturbed by people” (Water Studio NL).

In contrast, the Blue Economy has also been used to describe a floating nuclear power station built in Russia and launched earlier this year.
![]() Akademik Lomonosov floating nuclear power station, launched April 2019 (The Independent)
Akademik Lomonosov floating nuclear power station, launched April 2019 (The Independent)
Whatever you think of the term, the Blue Economy indicates an expanding interest in putting human-made structures in the ocean. There are already concerns about urban congestion turning into “marine sprawl”.
The consequences have the potential to be both good and bad. Either way, achieving these engineering feats will require greater investment and understanding in ocean science.
Artificial Intelligence and the Ocean
Can Artificial Intelligence (AI) predict the ocean better than dynamical models?
Machine learning algorithms – and more broadly, AI – promise fast computation of the world’s complex problems.
Nature published a study last month that claims to predict ENSO at lead times of up to one and a half years. The authors trained a convolutional neural network (CNN) on data from 1871 to 1973, and then applied the resulting forecast method for 1984 to 2017 (Ham et al 2019).

Does it work? Yes.
The forecast skill of the Nino3.4 index in the CNN model is systematically superior to all state-of-the-art dynamical prediction systems at lead times longer than six months
(Ham et al 2019)
The results are stunning.
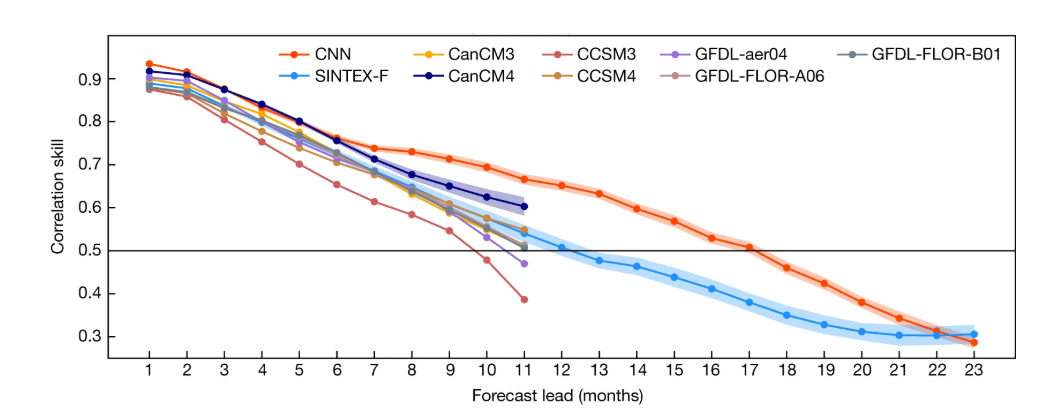
The CNN method has a hit rate of 66.7 % at predicting an El Nino event 12 months in advance.
A downside to machine learning is that it is a “black box”, whereby no physical interpretations can be applied to the algorithms inside. However, as this paper shows, the outputs can capture spatial complexity across the Pacific and show physically meaningful patterns.
What about finer scale ocean features?
At the Forum for Operational Oceanography in Melbourne this week, a number of presentations on machine learning were heard.
Jeff Hansen from UWA described a method to improve operational wave forecasts. The authors of this work (Hansen, Wu, Watson and Greenslade) applied a recurrent neural network (RNN) to 18 months of the Bureau’s archived wave forecasts at three wave buoy locations.
When the resulting RNN algorithm was applied to AUSWAVE-R forecasts, the output improved the RMSE by 19% for significant wave height and38 % for peak wave period. An impressive result.
Storm surge is another area where machine learning is being applied. Daryl Metters from the QLD department of Environment and Science presented on using AI-only to predict surge. Metters tried a range of machine learning techniques, using the inputs of tidal residual and weather at Clump Point in QLD. The neural network method was the most computationally expensive, while linear and tree methods were the fastest. A method known as Random Forrest produced the best results with a storm surge correlation of 0.4 to 0.5.
This is not quite enough to throw out the Bureau’s dynamical storm surge system which goes operational in the next couple of months. However, some success has been found in the UK by combining machine learning with computational hydrodynamics to predict inundation at ports (French et al 2017).
Perhaps these developments point to the future of AI and the ocean: dynamical models will provide the base output, then machine learning techniques can refine the results at targeted locations.
What do you think? Leave a comment below.
