
- Meteorological staff set sail for Antarctica
- Southern Ocean temperature profiles
- Teenage seal contributing to OceanMAPS
SST
Weak cool anomalies persist to the west and the south of Australia. In contrast, the northern and eastern coasts are neutral to slightly warm.

Sea level
Strong westerly winds on Friday and Saturday will drive a sea level anomaly dipole in the Bass Strait on the weekend, with a positive anomaly along the East Gippsland coast and a negative anomaly for northwestern Tasmania.

The sea level viewer predicts levels will exceed highest astronomical tide (HAT) at some locations in Port Phillip Bay, and possibly also at Lakes Entrance.

Antarctica
wildlife tracking
Wildlife has resurged in Antarctica as the summer season starts. Penguins return to their nests on the 17th of September each year, according to Australian Antarctic Division biologists. Sure enough, two weeks ago they returned at Casey station right on time. Last week Davis station (located further west at 78 E) also noted the return of the penguins and the birth of many new seal pups.
This spring activity is about one month later than Macquarie Island, described in the post from 27th of September.


Some of these seals are contributing to the global oceanographic effort by wearing CTD instruments on their heads. According to Coriolis, the Seal CTDs contribute 98% of the ocean temperature and salinity data in the Antarctic sea ice, and 80% of the data south of 60 S.
On the IMOS Seal CTD website, one or two seals are transmitting. See the profiles here. One of them, Q9901014, a juvenile male, is near 67 S 80 E. He is certainly in some chilly water.

Temperature profiles collected by seal Q9901014 – IMOS – Click to expand
So is this guy uploading data that gets ingested into OceanMAPS? It seems so. Looking at the ocean profile observation locations for the last few days, we can see one observation very close to the Antarctic continent. It is roughly the same location as our teenage seal Q9901014. Thanks Mr Seal!

sea state

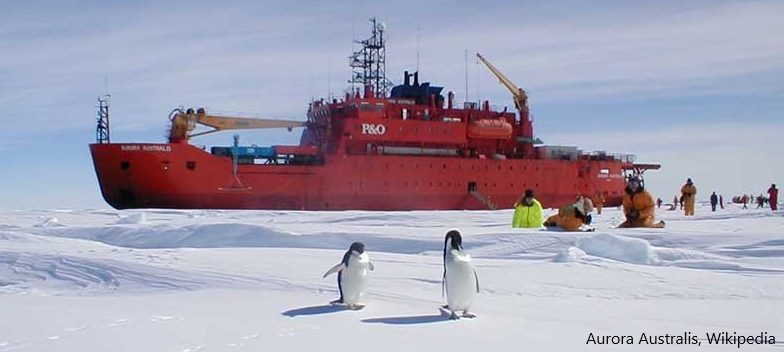
The ship Aurora Australis left Hobart last week bound for Davis station. Onboard are staff members from the Bureau of Meteorology who are on their way to scientific postings of 4 to 12 month duration. By now they are 7 days into the 15-day ocean journey. To try to track their progress we can check websites that show vessels’ AIS (Automatic Identification System) position.

A ‘special craft’ is currently located at 60 S 115 E. A ‘passenger vessel’ is located further north at 50 S 114 E. It is likely that the special craft is the Aurora Australis.
Wave models show two strong low pressure systems developing in this region in the next few days. Significant wave heights of up to 13.5 m could spin up tomorrow south of Tasmania. On Sunday another system further west will build the significant wave heights to 10-11 m.
Looking at the Auswave-G forecasts we can see that the southernmost ship is well-positioned to avoid the worst of the sea state in the coming days. If it is the Aurora Australis, it was probably a deliberate strategy to cross the Southern Ocean storm track quickly and make westing to Davis close to the ice edge. However, the passenger vessel is in the middle of the storm track and will likely experience some large waves on Sunday.


The blank areas of the Auswave-G chart show regions of sea ice. Where the sea ice concentration is greater than 25 % of a grid cell Auswave-G designates it as a dry cell and does not resolve any waves. You can also see that between the Antarctic land and the ice shelf there are some ‘wet cells’ where waves are resolved.
The ice shelf analysis in the wave model comes direct from a NOAA product which can be seen here.
 NCEP’s high-res sea ice analysis for 31st October, screenshot – NOAA
sea temperatures
Sea temperatures quickly become cold for vessels traversing southward. The image below is a comparison of three temperature profiles from the OceanMAPS webviewer. The blue profile is just south of Tasmania. It shows a shallow mixed layer of 75 m, then a deeper seasonal mixed-layer down to 320-370 m, before strong cooling with depth in the thermocline.
The yellow profile is in the location of the passenger vessel – near a sharp meridional SST gradient called the Antarctic Converge or Antarctic Polar Front. The profile shows fairly consistent temperatures of about 5 deg C down to the start of the thermocline at 325 m depth. Even at deeper levels of 1500 m the temperatures are a degree cooler than those off Tasmania.
The beige profile is in the location of the special craft and shows Antarctic waters. The surface temperature is 0 deg C and actually increases with depth, albeit only to 1.3 deg C at 325 m. It cools again below that and remains 1-2 degrees cooler than the yellow profile.

Within the ice shelf region further south, OceanMAPS has temperatures of -1.5 deg C at the surface, increasing with depth to 1 to 1.5 deg C in a similar way to the beige-coloured profile.
OceanMAPS v3.1 does not resolve sea ice.
How do the three locations compare on the T-S spectrum?

The Tasmanian location has a salinity minimum at 800-1100 m depth. This may indicate the presence of Antarctic Intermediate Water. AAIW is formed at the Antarctic Convergence where it sinks, being stuck between warmer salty water to the north and cooler salty water to the south. The yellow profile is very close to the Convergence zone and here we see a salinity minimum at the surface – it has not yet sunk.
The southernmost profiles show increasing salinity with depth towards 34.6 to 34.7 psu, and decreasing temperatures to 0 to 2 deg C. These values are indicative of Circumpolar Deep Water.
