
- Tropical water coming our way in surface jets
- Sydney SSTs jump
- Leeuwin Current – a tale of three cross-sections
SST
Cool in the west
Waters continue neutral to cool against the monthly mean around much of the country. As we saw last week, the cool anomaly of 1 to 2 degrees C in the northwest is an indicator of the potential for a positive Indian Ocean Dipole in the next month or two.

Tropical Water
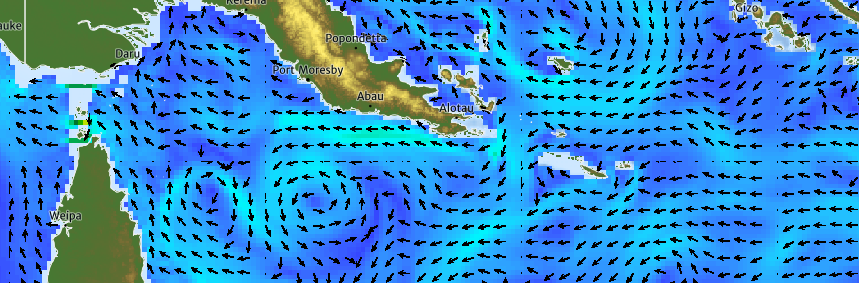
Warm water is pushing southward as we move into spring. In northeast QLD, warm and less saline water is pushing south-westward from PNG towards Australia. The movement is part of the South Equatorial Current (SEC), which is known to divide into jets as it moves past islands (Ganachaud et al 2007).


The jet of water moving past the tip of New Guinea (leftmost black arrow in salinity image) is perhaps stronger than usual and it runs in the opposite direction to the depth-integrated New Guinea Coastal Current.

The jet we see in the SST forecast is a surface current, and it will be locally strengthened by Ekman transport due to persistent southeasterly trade winds. See the gradient wind analysis below.

If we look at current velocity at two depths using the webviewer, we can see the contrast between the surface jet and the New Guinea Coastal (Under) Current. The surface water moves southwest and the deep water moves northeast!

The southwestward surface jets combine into the SEC which then bifurcates when it reaches QLD, and the southern arm forms the East Australia Current (EAC). The bifurcation point varies seasonally from 15 to 19 S (Ganachaud et al 2007). At the moment, OceanMAPS suggests a surface bifurcation point at the northern end of that range – 15 S – but with the extra push of SEC waters from the north we could expect the bifurcation point to move southward over the next month or two.

Sydney
Meanwhile in southern QLD and northern NSW – where the EAC is trapped against the coast and fuelled by the dynamics to the north – an area of warm water is expected to push quickly south. The push won’t have an easy time of it. It will come up against the cold water along the Tasman front and split off west and east.

However it is helping SSTs on Sydney’s beaches. On Monday the sea temperature in Sydney and Crowdy Head both jumped 1.5 degrees to 17.5 C as the warm EAC water that was sitting offshore finally pushed into the coast. The signal may have been affected by diurnal heating as well (particularly at Crowdy Head on the 11th), however the offshore location of the buoys mitigates this somewhat and some of the water temperature increase did persist into the night hours. In any case, the warmth eased back offshore again, perhaps due to upwelling from NE’ly winds, before temperatures starting to climb again today (13th). OceanMAPS has the EAC water filling into the coast all this week as the tropical water moves south … and perhaps Sydney is now finally free of those chilly anomalies of recent times.

Currents
The Lioness
The Leeuwin (“Lioness” in Dutch) Current is starting to ease back from full strength. However, it still coats the southwest capes with relatively balmy temperatures of 18 deg C.

Three cross-sections of the current show how the depth and width of the current are constrained as the current turns around the Capes.
At 30.4 S near the town of Cervantes, the warm water of the Leeuwin Current dominates the upper layers of the ocean. Temperatures of 19 to 20 deg C occur up to 120 nm (220 km) offshore and down to 180 m of depth. Some of this large width is due to a warm eddy (seen as the left-most warm patch in the cross-section).
Off the coast of Perth the current is visible as a large bulk of 19 deg C warm water that is still 180 m deep, but now only 60 nm (110km) wide. The warm eddy is not present. Indeed, the raised thermocline at 113 E suggests a weak cold core eddy, which is confirmed in SLA images.
Further south, between Cape Naturaliste and Cape Leeuwin, the current is 18 deg C and only 22 nm (40km) wide and a shallower 135 m depth. The physical dimensions of the current are reduced, but the volume transport remains high as current is coastally-trapped.


