
- Oma eddy causes shift in bifurcation point
- ‘Perfect storm surge’ possible next week
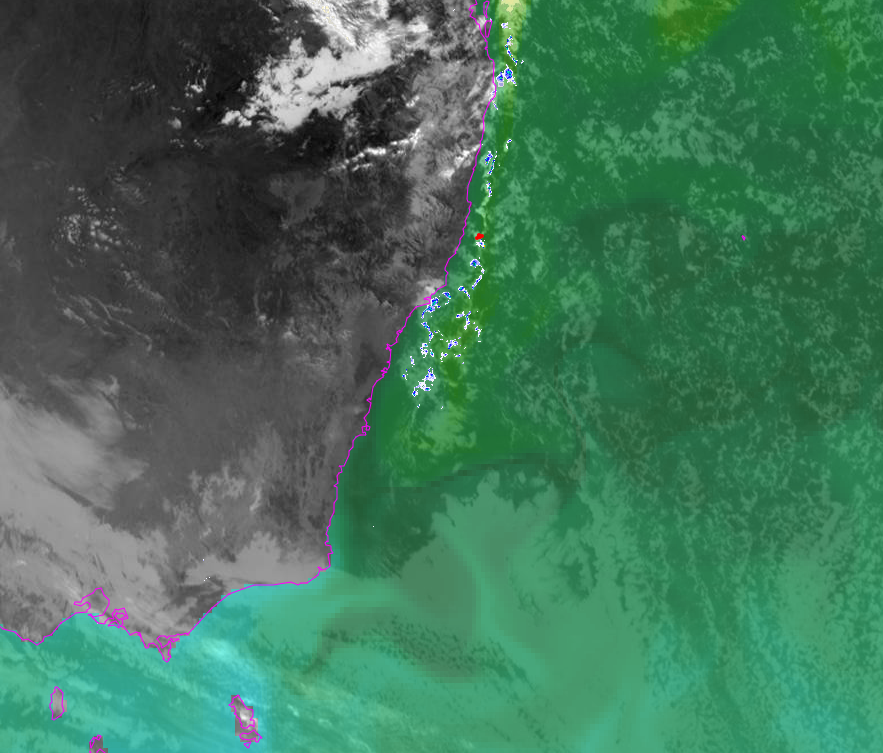
- Showers over hot water in NSW
SST update
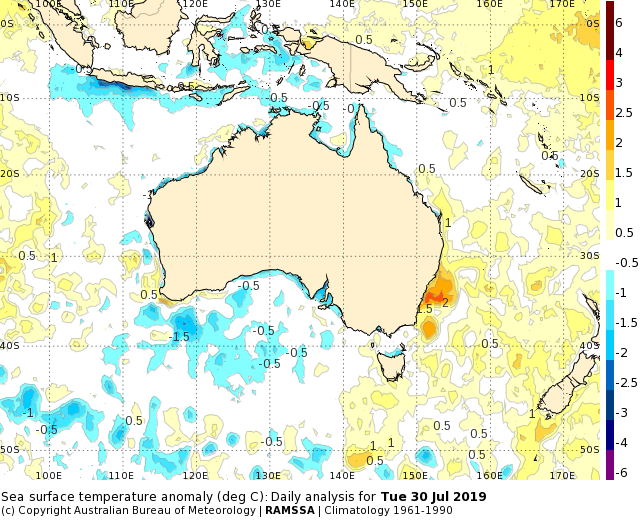
NSW waters remain very warm with temperature anomalies there at 2 deg C. Water temperatures themselves are 20 to 21 deg C as far as 36 S.
The hot water is encouraging convection. This week we have seen frequent convective showers along the NSW and southern QLD coast.
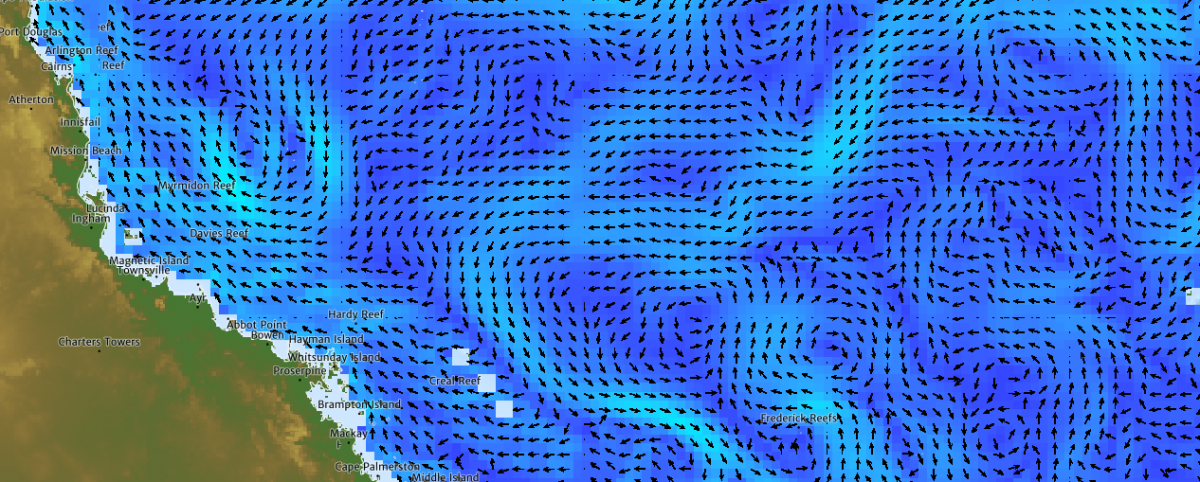
Bifurcation point moves south
The cold core eddy from TC Oma in February has reached the coast and is causing an upset in surface currents.
For the formation of the feature, see an earlier post that forecast that the eddy would arrive on the 31st of July. It is here right on time.
A recent article on Ocean Current describes how the flow around the eddy is causing warm temperature anomalies in the southern part of the Great Barrier Reef.
But what about further north? And how is this feature affecting the inbound South Equatorial Current (SEC)?
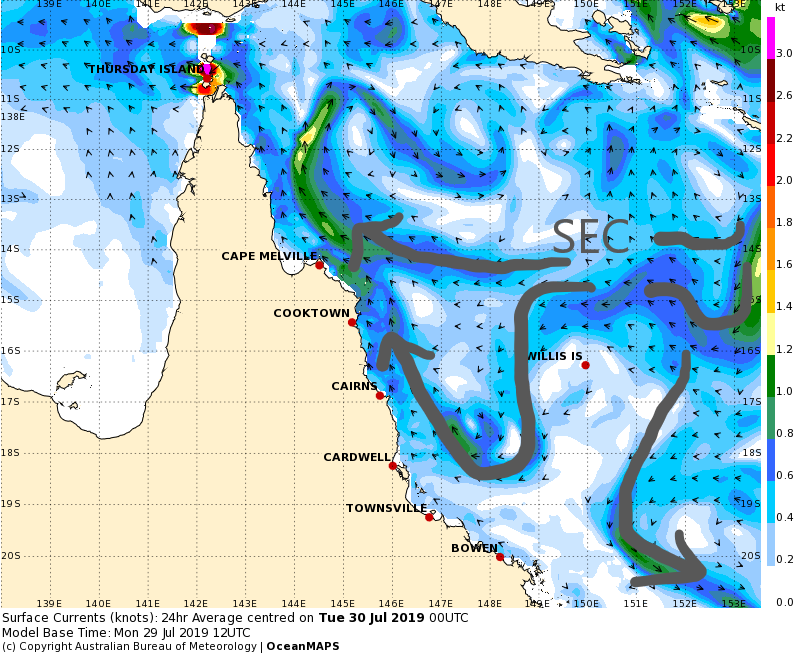
It looks like the eddy is drawing down SEC water and some of it retroflects back northward along the coast. Meanwhile the southward EAC flow doesn’t clearly start until 20 S. We could say that the effective bifurcation point is at 19 to 20 S on the southern side of the eddy.
The SEC bifurcation point has been analysed at 15 S at the surface and 22 S at 800 m (Qu and Lindstom 2002). By integrating with depth, it has been calculated that the latitude of zero total meridional transport is 17.8 S.
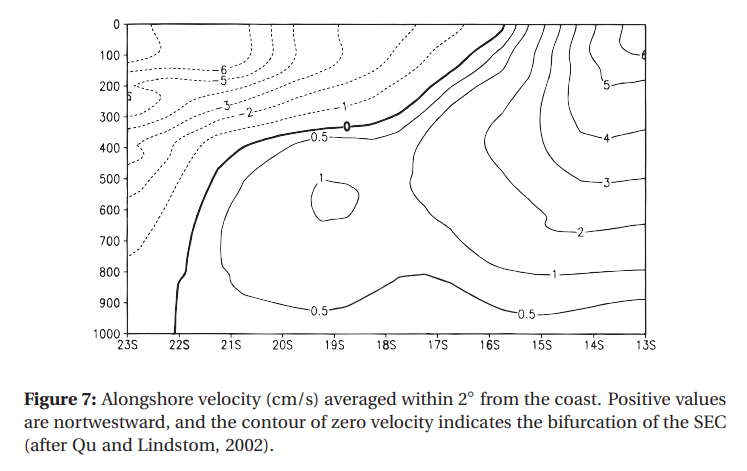
This is not set in stone. Studies have shown that the surface bifurcation does vary, perhaps as much as 15 S to 19 S according to regional wind changes (Ganachaud et al 2007). [And … we might like to add ‘mesoscale eddy disturbances’].
A more detailed analysis by Ridgway et al (2018) demonstrated that the SEC actually separates into two jets: the shallow North Vanuatu Jet (NVJ) which reaches the coast at 14.4 to 14.7 S, and the deeper North Caledonia Jet at 18 S. These jets bifurcate at the shelf edge and the northward components contribute to the Gulf of Papua Current.
The TC Oma eddy seems to be deviating part of the shallow NVJ.
Let’s have a look at the TC-Oma eddy with depth, and how the pattern compares to what we might normally see here at this time of year.
OceanMAPS webviewer shows that the maximum strength of the flow on the eastern side of the eddy is between 0 and 80 m deep. The eddy itself is about 200 m deep. On the western side of the eddy the northward current blends with the Gulf of Papua Current at depths greater than 200 m.
Velocity images with depth show the influence of the coastal shelf on the bifurcation latitude.
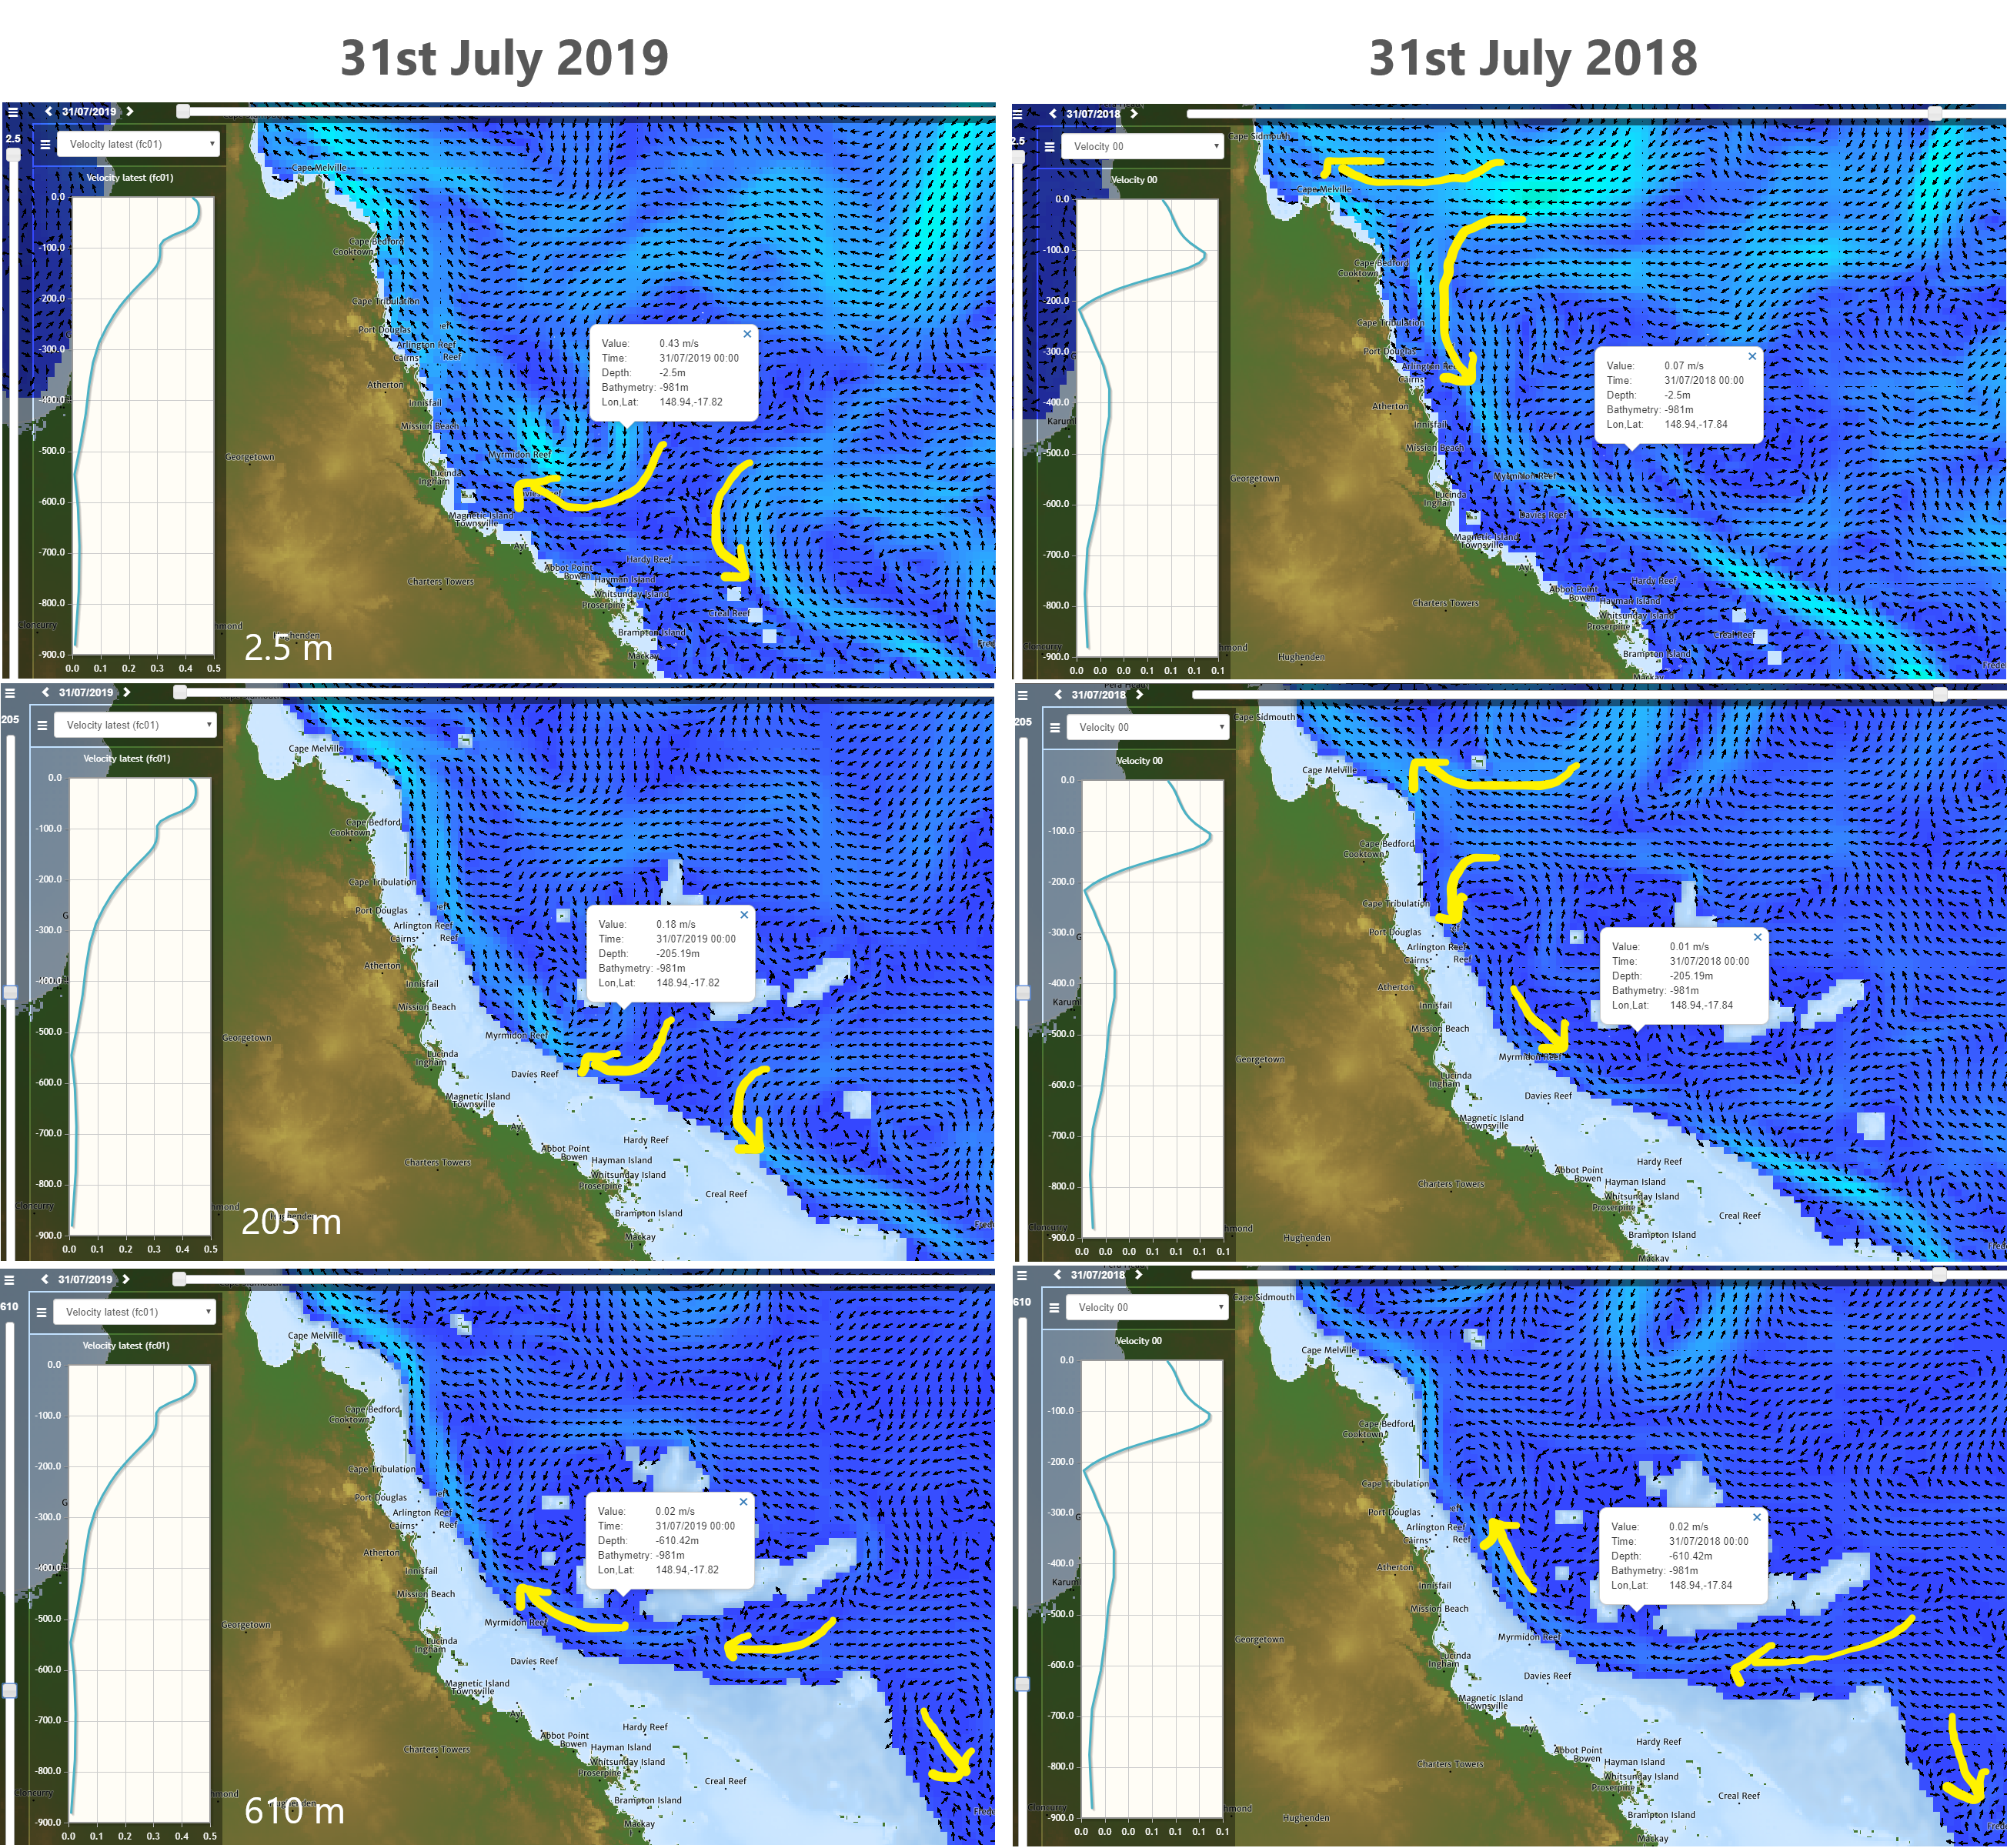
At the same time last year the bifurcation at the surface was a lot further north. But at 610 m depth the current patterns are very similar year to year. The TC Oma eddy is mainly affecting shallower water.
Why do we care about bifurcation latitudes?
One point of interest this week is that the current bifurcation coincides with a ‘bifurcation’ of the surface temperature anomalies.
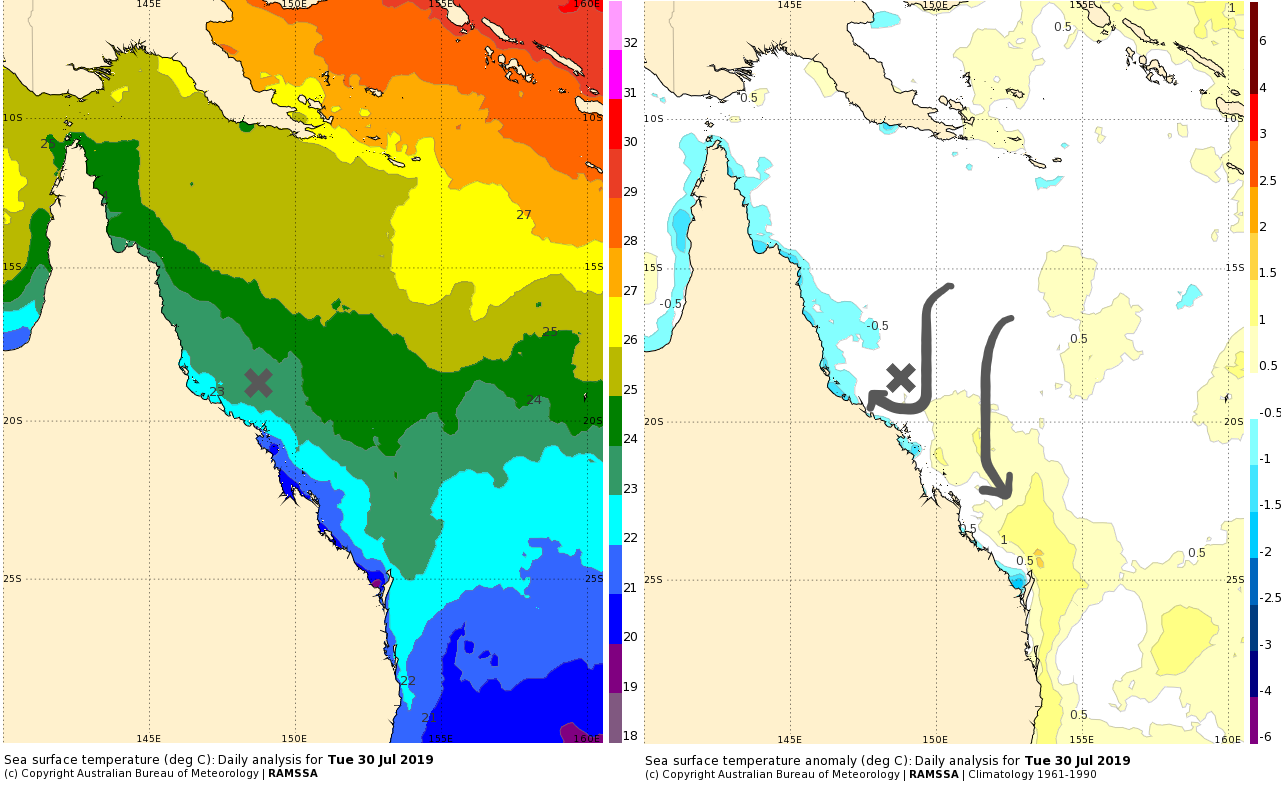
The southern arm of the SEC water is diverted straight southward down the eastern side of the eddy (further east than usual), causing a warm anomaly along southern QLD as shown in OceanCurrent News.
However the northern part of QLD is suffering from less direct SEC flow. The diverted flow that curls around the eddy and flows back northward again may have cooled at the more southern latitudes before returning to the northern arm, contributing to a cool anomaly along northern QLD.
In this way, TC Oma in February has disrupted the normal flow of the SEC into the coast, at least at the surface, and continues to influence the coastal SSTs six months after the atmospheric event.
Perfect storm surge in outlook
Next week we could see the ‘perfect storm’ surge in the Great Australian Bight.

Yasha Hetzel from UWA studied coastally-trapped waves along Australia’s south coast using HF radar data. Storms across the Bight usually propagate faster than CTWs. This spreads out the signal and complicates analysis.
At the AMOS conference in June, Yasha contended that the ‘perfect storm’ would be a slow big storm that moves along the Bight at 5 to 7 m/s: the same speed as a CTW.
This storm might happen on Wednesday and Thursday.
On Wednesday ACCESS-G predicts the centre of the low to be at 43 S 130 E at 00 UTC and 43 S 134 E at 12 UTC. Some back of the envelope calculations:
- 240 nm of easting = 444 km in 12 hours
- Speed = 37 km/hr = 10 m/s.
Perhaps still a touch too fast.
However on Wednesday night into Thursday morning the system slows down and even retrogresses briefly back to 132 E by 00 UTC Thursday, before moving eastward later.
This will be the time of maximum resonance: when the forcing and the CTW are moving at similar speeds.
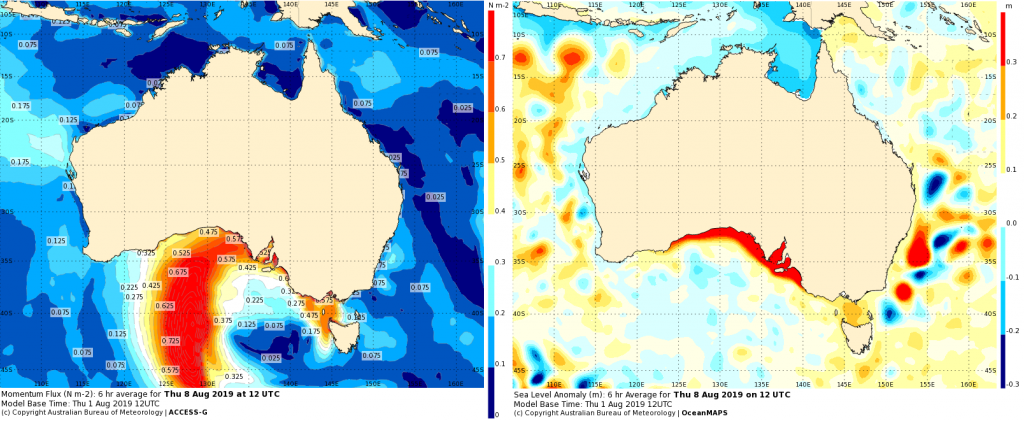
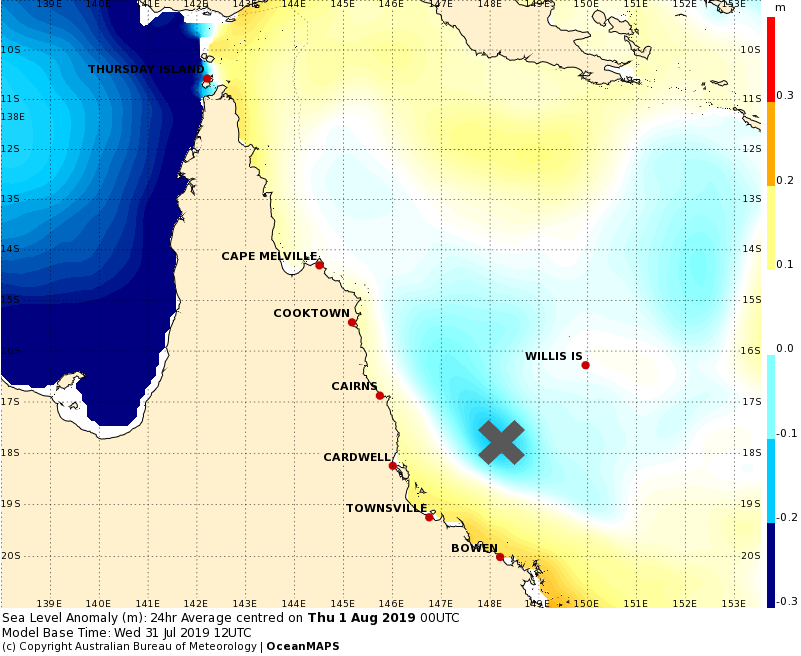
Sea level anomalies could be as large at 0.7 m according to OceanMAPS.
The sea level viewer alerts are going off the scale!
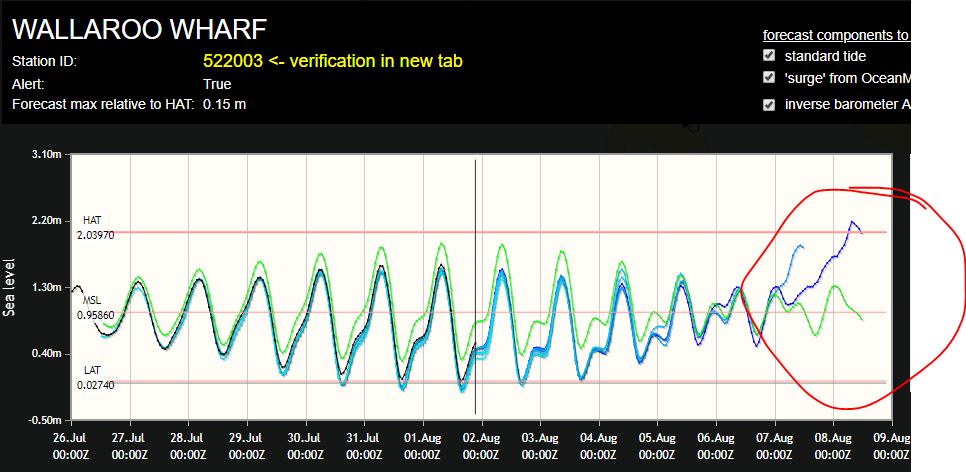
Luckily this event will coincide with neap tides, otherwise the coastal inundation risk would be worse.
There is still model uncertainty between ACCESS and ECMWF, so this event is by no means guaranteed. Stay tuned to see what eventuates….

It would be great if the national storm surge model forecast for the GAB event could be looked at as well. Keen to know how this new kid on the block compares to OceanMAPS and the aggregate sea level system.
Hi Eric, yes its definitely worth comparing the different systems. The national storm surge model only goes out to 3 days, so we can have a look at the outputs for this event early next week.