
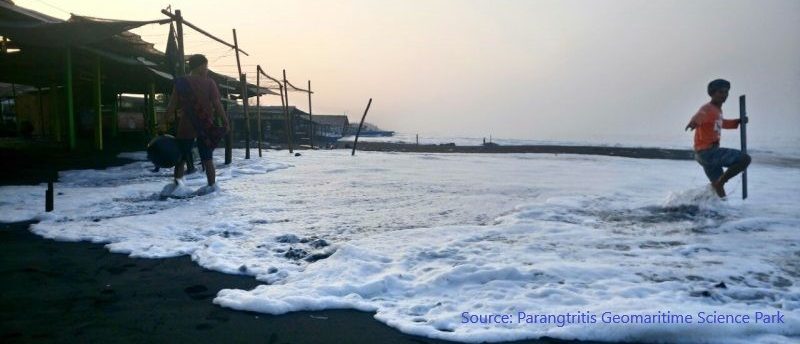
- Indonesian south coast awash, slammed by ‘waves from Mascarene high’
- Port Phillip temperatures plummet
- NSW inshore waters cooler than normal
SST
With another month of winter cooling to go, in some parts of the country sea surface temperatures are already approaching their annual minimums.

This is particularly true in Port Phillip Bay. Three different sensors within the Bay are recording temperatures of 10.1 deg C, which is close to the climatological minimum of 10.0 deg C usually reached in mid-August.
Are you brave enough to swim in #PortPhillipBay in winter? 🏊♂️ Sea temps are approaching their lowest values for the year—dropping to 10.2°C in the bay. But, you might be surprised that the open ocean outside the Heads is actually warmer—a balmy 13°C! https://t.co/Z7T7cFWanL pic.twitter.com/7PJaI60u1F
— Bureau of Meteorology, Victoria (@BOM_Vic) August 2, 2018

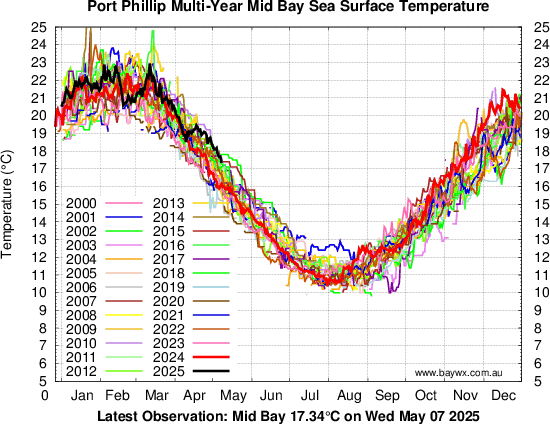
Outside the heads, the temperature in the Bass Strait remains a relatively warm 13 deg C and still has to drop another degree to reach the climatological mean minimum at the end of August.

The amplitude of the seasonal temperature signal inside the Bay is larger than that of the ocean. The Bay cools and heats more effectively with the seasons due to the shallow bathymetry and semi-enclosed nature of the basin. It is also cut-off from the influence of warm ocean currents such as the Leeuwin Current Extension which can be seen on IMOS Ocean Current maps.

The waters are also relatively chilly off Sydney at the moment due to the influence of a cold core eddy over the last few weeks. Another contributor is cold water intrusions along the coastline which are driven by strong post-frontal southerly winds. Sea temperatures have dropped as low as 17 degrees in Sydney and 15 degrees in Batemans Bay. This is anomalously cold, particularly along the northern NSW coast where it is showing up in OceanMAPS as lower than the 5th percentile. In contrast, further offshore in the EAC extension the sea surface temperatures are remaining anomalously warm at 21 deg C.

The OceanMAPS model is forecasting the cold core eddy to weaken over the next few days. This allows the warmer EAC water to push further inshore, and the cold water will retreat down the coast.


Sea level and waves
The Southern Java coastline has been hit by large southerly swell in recent weeks. People have been warned not to go to the beach because of the wave heights, and several tourist hotels have been flooded along the coastline of Bali. There are reports of sea water spreading about 70 m inland. Markets have been flooded. Fisherman have been unable to go to sea and the price of fish has skyrocketed. Footage can be seen on YouTube.

A major Indonesian newspaper, Kompas, carried the following headline on the 26th of July:
“Warga panic, lari ke bukit”
This translates to “People panic and run for the hills”.
The Indonesian BMKG continued to warn about ‘very dangerous’ tall waves this week. Online news articles attribute the cause of the large waves to propagating swell from Mascerene High pattern.

The Mascerene high is named after the group of islands that comprise of Mauritius, Réunion, and Rodrigues. The phenomenon is usually discussed in terms of its role strengthening the southeasterly trade flow in the southern Indian Ocean. This wind recurves in the northern hemisphere to feed the Indian monsoonal flow.
For the Mascerene high to cause southerly swell in Java over an extended period of time it would need to be further east than its climatological position. However, there is no evidence that July had an anomalous MSLP pattern, or that the Indian Ocean Dipole was active. The cause must have been shortlived on a timescale of around a week.
High pressure in the east Indian Ocean was analysed between the 21st and 24th of July, with a cold front passage on the 25th. Significant Southern Ocean swell propagated northward at that time.

Looking around for other culprits, … the sea level anomalies (tide excluded) for this region are negative, and have been for a few weeks due to upwelling from the southeasterly trade winds. Therefore elevated sea level was not a contributing factor.

However, large spring tides around the blood full moon and lunar eclipse on the 28th of July would have caused elevated sea levels around the time of the event. Tidal records show below confirm the tidal range increasing last week.

Wave forecasts did pick up the phenomenon. We can compare the forecasts from BMKG with BOM and see similarities. Significant wave heights of 4 to 5 m with peak wave period of 17 seconds were forecast for the 30th of July.


Note some propagation of wave energy through the Lombok Strait in Auswave-R. The Indonesian model seems to have weaker propagation through the Strait but larger waves from local wind forcing on the northern side.

A study of a similar event in 2016 (Nugraheni 2017) suggests that coastal inundation in Southern Indonesia is caused by a combination of swell events, SLA and spring tides. Sea level anomaly was not a factor in this 2018 event, but the other two contributors were significant enough to cause the unusual event.

On the peak-period beam: this pattern should be interpretted with caution as directional spreading artfacts are known to occur in spectral wave models – especially where spatial features as small as the Lombok Strait are involved .
@andy Yes. Could it be Garden Sprinkler Effect?