
SST
Sea surface temperatures are cooling around the country but are roughly on track for this time of year, with most anomalies hovering around neutral. In the tropics there is a negative anomaly in inshore waters – this shows the seasonally-driven production of cool winter waters in the shallow regions with a sharp temperature front between this and the warmer waters offshore. The front is gradually moving offshore, since forming in May.

The Leeuwin Current pathway is continuing to show a warm anomaly, all the way from Cape Leeuwin to western Tasmania. The current then extends eastward and joins up with a warm core eddy off the southeast of TAS. Temperatures there are around 15 degrees C which is 2 to 2.5 degrees above average for this time of year.

In Victoria, Port Phillip Bay is cooling rapidly. Temperatures have dropped to 13 degrees C while the ocean outside remains at 15 degrees. Typically the Bay cools to about 10 degrees C by August while the ocean remains warmer.

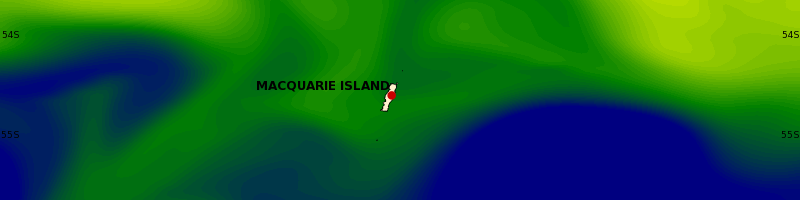
If you think that is cold, spare a thought for Macquarie Island at 54 S. Looking at the SST chart below, the island is surrounded by 6 degree C water, but the dark blue 2 to 3 degree C water is not far away. In fact the lobe of 6 degree C water to the southwest of the island is acting as a warm eddy and showing closed anti-clockwise rotation.

While the sea is cooling on the surface, there remains heat at depth, in the ‘heart’ of ocean heat content. The below image shows the temperature exceedence above the 75th percentile at 115 m below the surface. Around most of the country there is a peak of exceedence between 100 and 165 m depth, with values up to 3.5 degrees. See the web viewer to have a look.


Sea level
There are quite a lot of HAT exceedences showing up on the sea level viewer for this week. Most affected locations are in SA and VIC for the next few days due to the nearby low pressure and onshore flow. We are also approaching spring tides tomorrow. For many places the ensemble of sea level runs has captured the event well, but perhaps has slightly overshot the peak. (Compare the ensemble of blues against the measurements which are black). As the low pressure system moves into the southern Tasman Sea over the weekend the sea levels are also expected to increase in southern NSW. The effect is amplified by a coastally-trapped wave that moves along the NSW coast on Monday.


Sound Speed
Increasing eddy activity from the Leeuwin Current is causing large variability in temperature, salinity and sound speed forecasts run to run. The image below is a three day forecast from two consecutive runs. It shows big differences in the shape and depth of warm eddies spinning off from the Leeuwin Current. This introduces uncertainty in the sonic layer depth forecasts. At the selected point off Shark Bay, there is a difference of 40 m between sonic layer depth values.


Too chilly for a swim
I really like the title of cold sea and warm heart!
I agree